Generate Visualizations from the Home Page with Questions
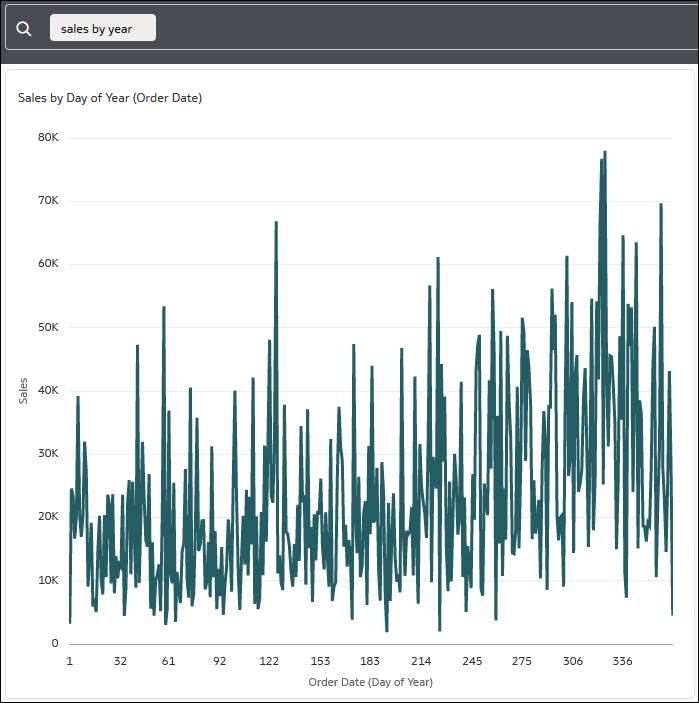
You can enter prompts into the search bar on the Home page to generate visualizations.
You must index your datasets before you or other users with access to them can use them to build visualizations from the Home page. See Index a Dataset.
You can certify datasets to ensure that their contents rank high in search results. See Certify a Dataset.
You can assign synonyms to dataset columns. Use synonyms that are familiar to user to ensure successful searches. See Specify Synonyms for Dataset Columns.
