Developer Options
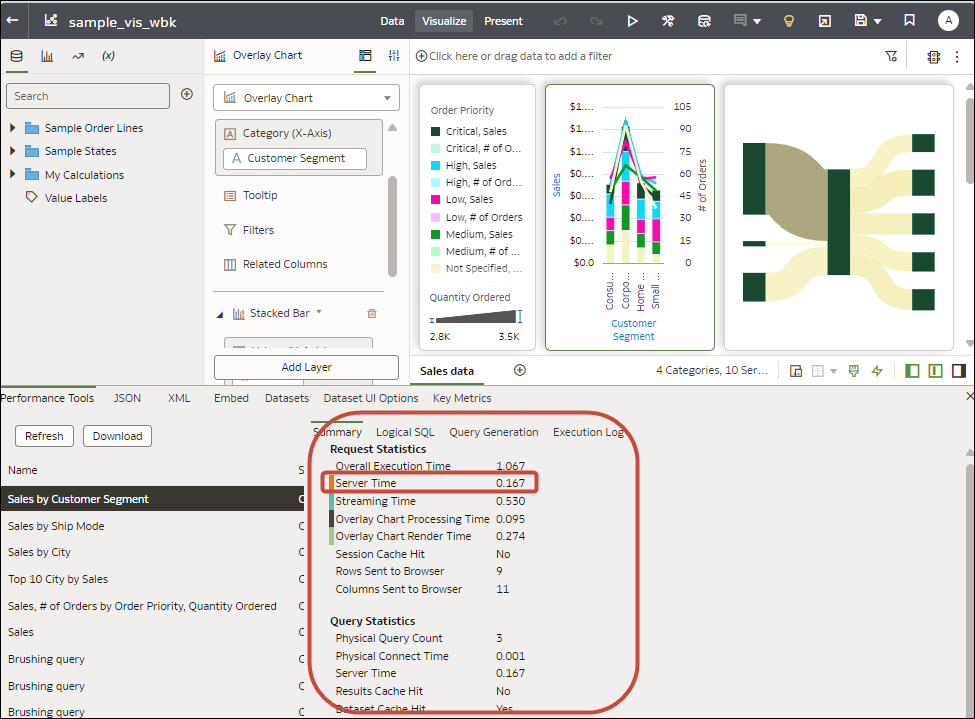
The Visualize canvas includes developer options that enable you to embed analytics content in other applications, and review performance statistics for visualization components. To use developer options, you need to be logged in with administrator or content author privileges.
To display Developer options, open a workbook, display the Visualize pane, and click Menu (![]() ), then Developer.
), then Developer.
| Tab | Description |
|---|---|
| Performance Tools | Review performance statistics such as query time, server time, and streaming time for visualization components in a workbook.
Click Refresh to get the latest statistics. You can then use the following tabs to analyse performance: Summary, Logical SQL, Query Generation, Execution Log. Tip: When you're looking at metrics on the Summary tab, to see a more detailed definition of each metric, hover over a metric in the Request Statistics column or a legend on the adjacent chart. For example, hover over Server Time to find out more about how this statistic is calculated. |
| Embed | Embed Oracle Analytics content in other applications. Use the Copy option to copy HTML code that you can paste into another application so that Oracle Analytics content is displayed. |
| JSON | Find out a column reference for embedded content that uses filters. |
| XML, Datasets, Prep Datasets, Prep UIOptions | Don't use these tabs. They're for internal diagnostics only. |
Enable Developer Options
You enable developer options in Oracle Analytics Server to perform advanced tasks, such as accessing embedding links or analyzing workbook performance. You must have administrator or content author privileges to enable and use developer options.
&devtools=true.
