Inspect the Data in Physical Tables
You can preview and inspect the data in physical and alias tables that use relational data sources.
-
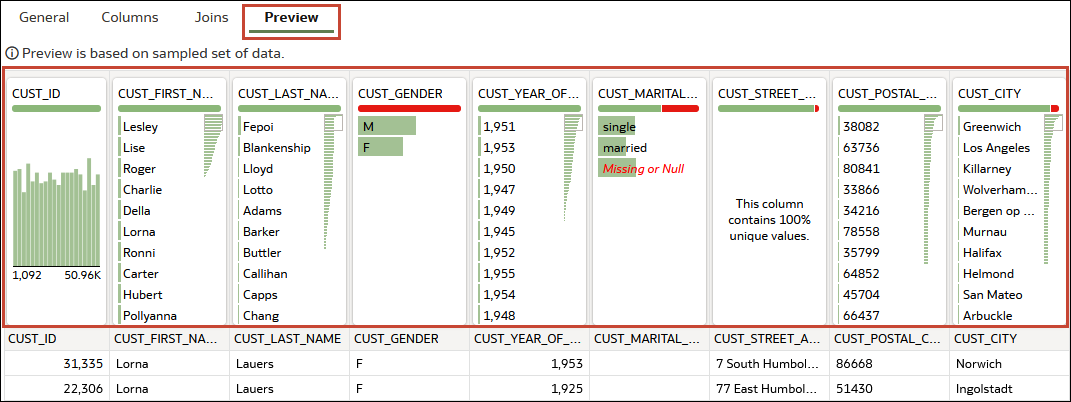
Tiles - Shows a distribution of each column's data, uniqueness of values, minimum and maximum values, the percentage of missing or null values, and the percentage of invalid values. You can use tiles to filter column data in the table preview.
The tiles area of the table preview displays if you have the Create and Edit Datasets permission.
The table preview includes tiles only if the table contains 125 or fewer columns. See Filter Preview Data in Physical Tables.
-
Table - Shows a simplified sample of the data values for each column. You can use a preview tile to filter the data displayed in the table to identify relationships and dependencies between columns.
- On the Home page, click Navigator
 and then click Semantic
Models.
 - In the Semantic Models page, click a semantic model to open it.
- Click Physical Layer
 .
. - In the database pane, double-click the table to inspect its data.
- In the physical table, click the Preview tab.
