Tips on Editing a Visualization
These tips can help you become more productive when you work with visualizations.
Access visualization options
The visualization toolbars provide quick access to formatting and editing options, and a menu (![]() ) with additional options.
) with additional options.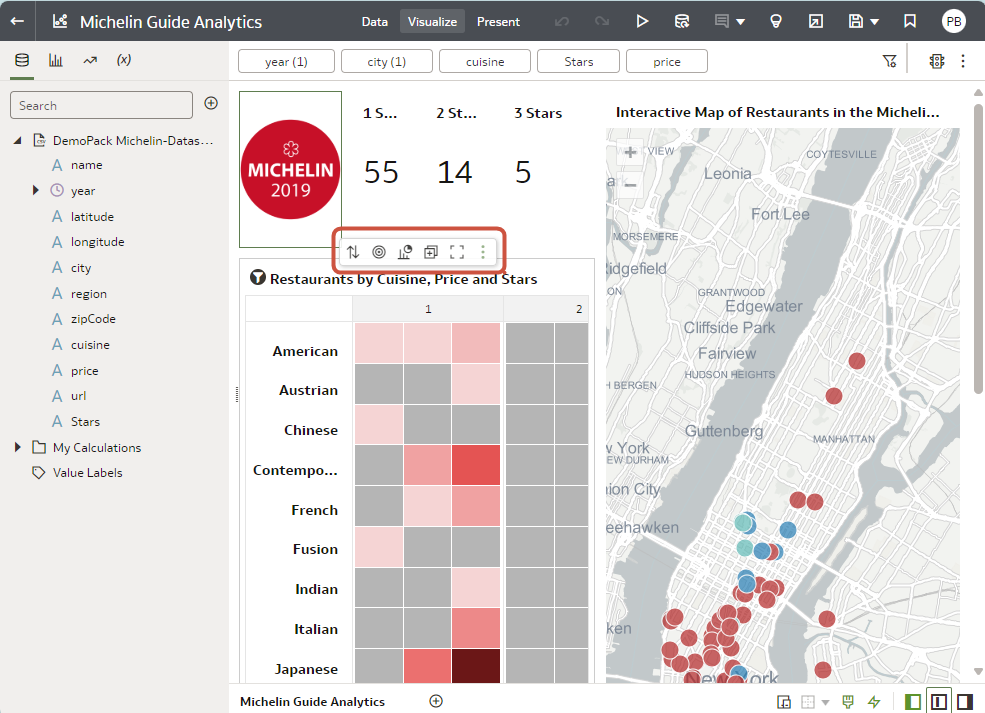
Description of the illustration viz_options.png
Access the visualization menu
Hover over a visualization, and click Menu (![]() ) to access editing options.
) to access editing options.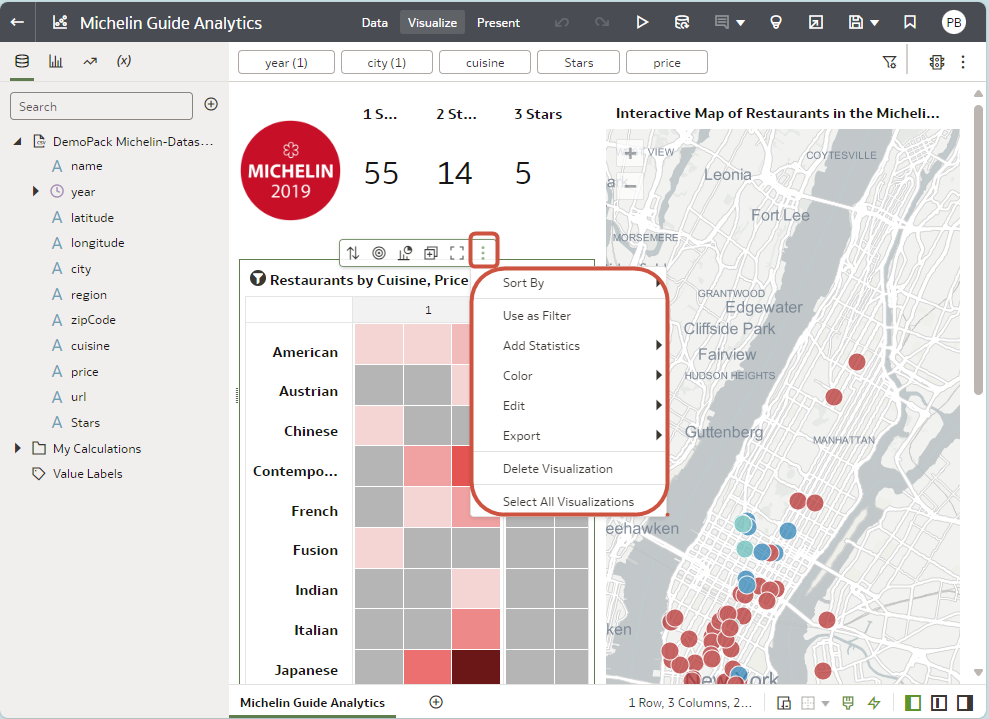
Description of the illustration viz_menu.png
Access the tooltip toolbar for data points
Click one or more data points (use Ctrl + click to multi-select) in a visualization to display navigation options in the tooltip toolbar:
- Keep Selected - Filter on the selected values.
- Remove Selected - Remove the selected values from the visualization. Click Undo to re-display the value.
- Drill Action Menu - Drill to a related area of your data.
- Data Action Menu - Select action links that the workbook author added. For example, an action link might navigate to a related workbook or display a web page.
Tip: Right-click data points to access the full menu of options, such as Sort By and Zoom.
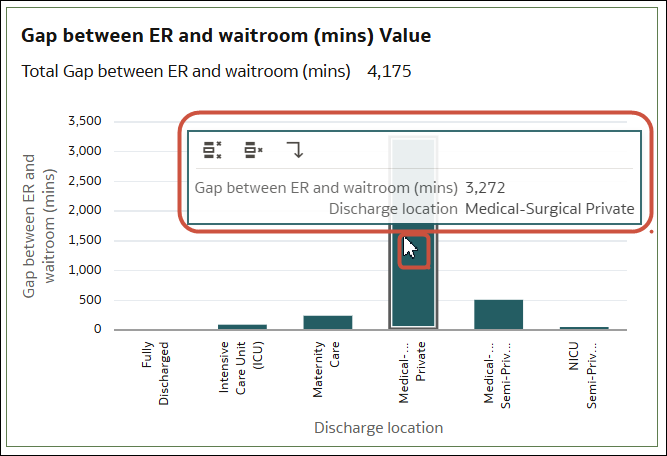
Description of the illustration interactive-tooltip-dialog-exp.png
Add a data element to a visualization
Drag the data element from the Data pane over the visualization
until the cursor displays a green cross, indicating a valid drop
zone.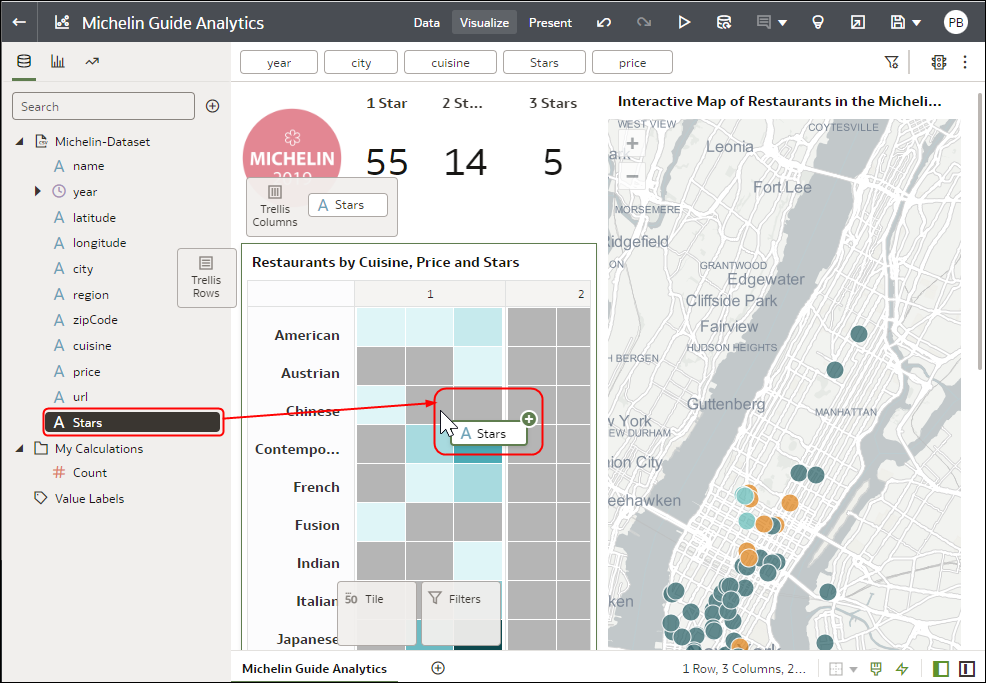
Description of the illustration viz_drag1.png
Add a data element to a new visualization
Drag the data element from the Data pane over the visualization
until the cursor displays a green bar, indicating a valid drop
zone.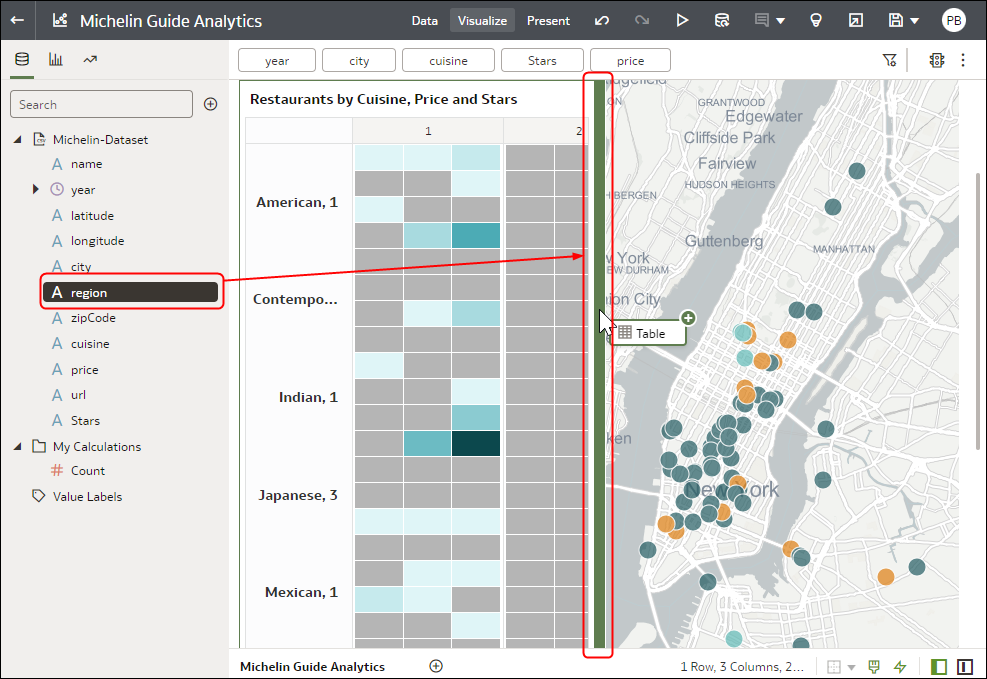
Description of the illustration guid-a1728b5c-6804-4e31-bbc7-f6ac9ccff685.png
Delete a data element from a visualization
In the Grammar pane, hover over the data element, and click
X to delete.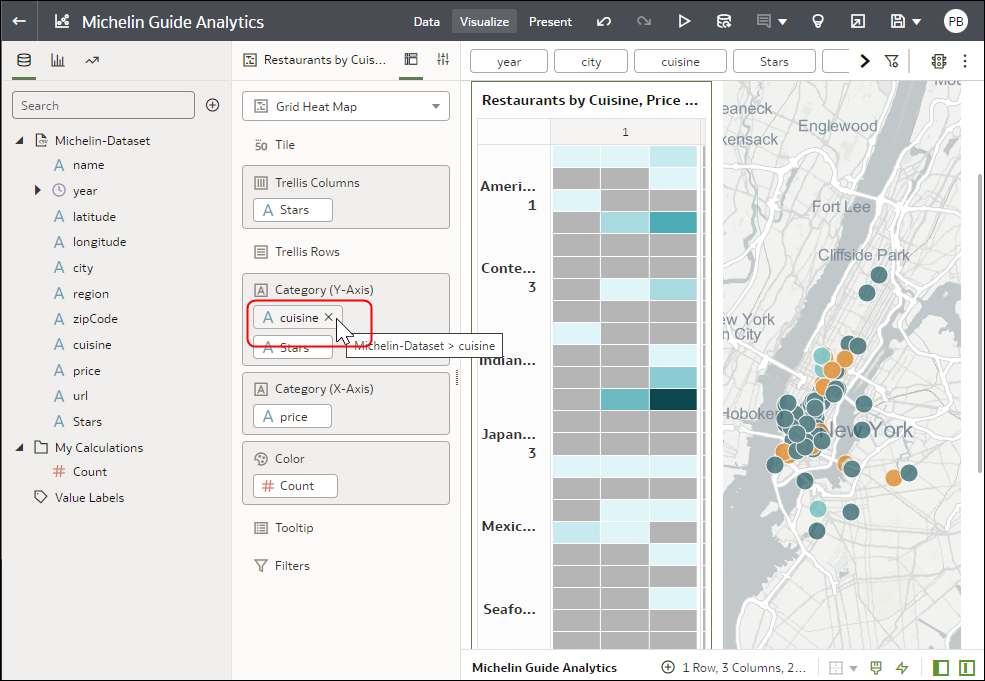
Description of the illustration viz_field_del.png