Display Values in Table and Pivot Visualizations as Links
You can configure table or pivot visualizations to display table cell values as links. Consumers can see which values are URLs and then click the values to immediately invoke a data action.
You can display column values as links in tables or pivots to invoke data actions that are anchored to that column. If a data action is anchored to multiple columns, the table or pivot visualization must contain all of the columns used by the data action.
See Create Data Actions to Connect Canvases or Create Data Actions to Connect to External URLs from Visualization Canvases.
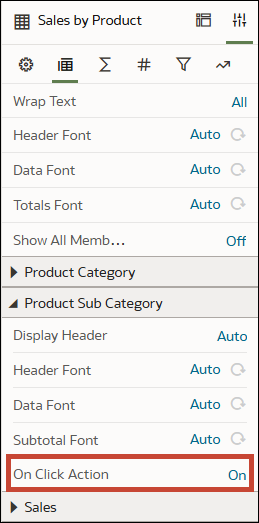
- Auto - Enables all the data actions anchored to the column. If there's more than one, a menu is displayed for the consumer.
- <Data Action> - Enables the link for that specific data action. If more than one data action is available, you can select as many as you want to enable.
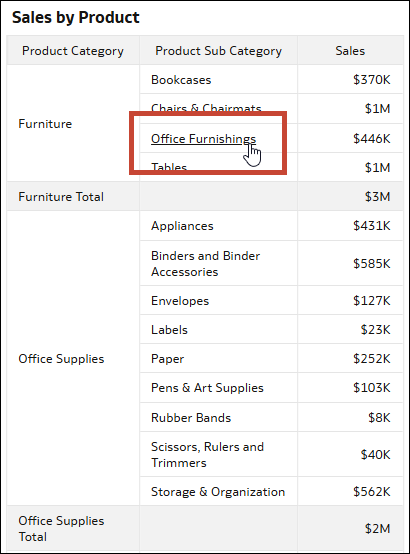
Consumers can hover over the column values in the visualization to easily see which ones are links, indicated by an underline. They can then click the linked value to directly invoke the data action. If more than one data action is defined and available for a column, consumers can choose which one to invoke from a drop-down list.
Description of the illustration data_actions_show_table_hyperlinks.png
If a data action is inaccessible to a consumer, and you've selected the Show Accessible Only setting in Present, they can't see the data action, even if you've made it available using the On Click Action property. See Hide Inaccessible Data Actions in a Workbook from Consumers in Present.
