Apply a Dashboard Filter to Visualizations on the Canvas
When you add a dashboard filter, Oracle Analytics applies it to all visualizations on the canvas. You can specify which of the visualizations you don't want to apply the dashboard filter to.
- On your home page, hover over a workbook, click Actions, then select Open.
- Click the dashboard filters visualization to select it.
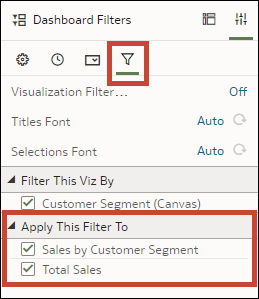
- Click Properties to open the Properties pane, then click Filters.
- In the Apply This Filter To section, deselect the visualizations that you don't want the filter to apply to.
- Click Save.
