Predefined Oracle Analytics topic reports
Predefined Oracle Analytics reports are available from a link on the Topic Management page if your database administrator and IT administrator installed and configured Oracle Analytics and its components.
Note:
Planned actions are excluded from the reports.Note:
Options in drop-down lists appear in case-sensitive alphabetical order.Action State Timelines
| Description | Filters for Data Retrieval | Columns |
|---|---|---|
|
Provides the total elapsed time in days that each Action spent in a specific state. Computes the elapsed time using the Action Modification Date. If this date is unavailable, computes the time using the Action Creation Date. Sorted in order by Topic ID by Action ID by Action Version ID. Action Version ID is not a visible field. |
|
|
Action State Timelines Sample Report

Actions by Status
| Description | Filters for Data Retrieval | Columns |
|---|---|---|
|
Provides topic information based on action status. Sorted in order by Action Status by Planned Completion Date by Action Name. |
Note: To ensure that the query retrieves all data for a specific day, you should increase the date in the To field by 1 day. For example, to retrieve topics with Action Modified dates from 02/01/2012-02/04/2012, specify a From date of 02/01/2012 and a To date of 02/05/2012. |
|
Actions by Status Sample Report (partial)

Actions by Topic
| Description | Filters for Data Retrieval | Columns |
|---|---|---|
|
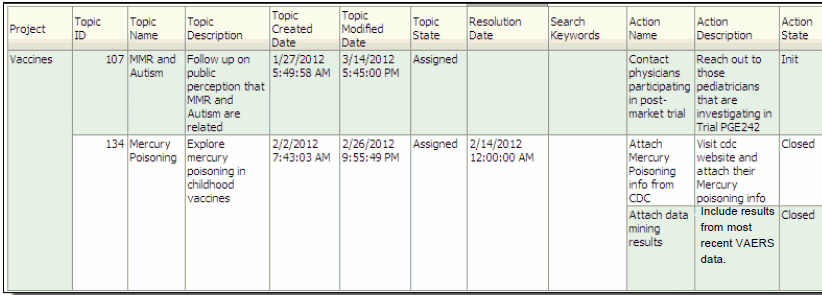
Provides topic information based on topic action. Sorted in order by Project by Topic Name by Topic Modified Date by Action Name. |
|
|
Actions by Topic Sample Report (partial)
Attachments in Topics
| Description | Filters for Data Retrieval | Columns |
|---|---|---|
|
Provides topic attachment information. Sorted in order by column from left to right. |
Note: If a topic has not yet been modified, the topic Creation Date is used in topic retrieval. |
|
Attachments in Topics Sample Report

Topic Counts by Work Team/User
| Description | Filters for Data Retrieval | Columns |
|---|---|---|
|
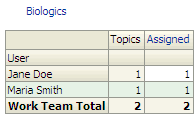
Provides the number of topics in each state assigned to each user on one or more work teams, and the total number of topics assigned to the work team. There is one table for each work team. Sorted in order by work team user. Note: Topics that are visible to a work team but are not assigned to a member of the work team are not included in the Work Team Total. |
|
Note: If no topics are in a given state, the Topic State column does not appear. |
Topic Counts by Work Team/User Sample Report
Topic State Timelines
| Description | Filters for Data Retrieval | Columns |
|---|---|---|
|
Provides the total elapsed time in days that each topic spent in a specific topic state. Sorted in order by Topic Version ID. Topic Version ID is not a visible field. Note: If the total elapsed time is less than 12 hours, the time period appears as 0 days. |
|
|
Topic State Timelines Sample Report

Topics by State
| Description | Filters for Data Retrieval | Columns |
|---|---|---|
|
Provides topic information based on topic state. Sorted in order by State by Project by Topic ID. |
Note: To ensure that the query retrieves all data for a specific day, you should increase the date in the To field by 1 day. For example, to retrieve topics with Topic Modified dates from 02/01/2012-02/04/2012, specify a From date of 02/01/2012 and a To date of 02/05/2012. Note: If a topic has not yet been modified, the topic Creation Date is used in topic retrieval. |
|
Topics by State Sample Report

Average Duration in Topic State
| Description | Columns | Bar Graph Details |
|---|---|---|
|
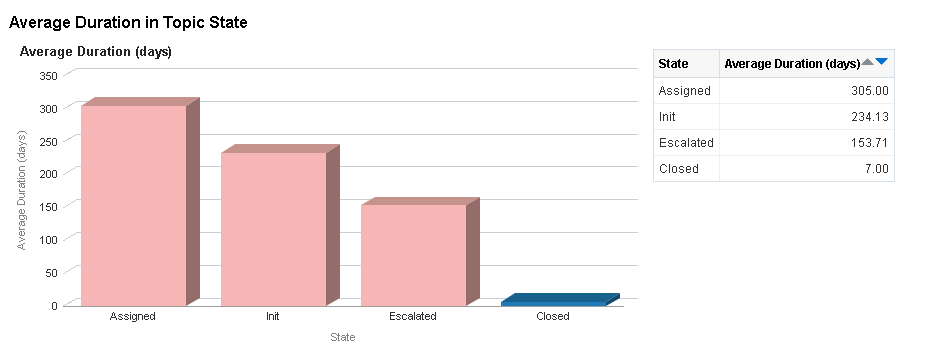
Provides the average length of time a topic has spent in a state. The topic’s current state is not considered as part of the report. Sorted by average duration. |
|
|
Average Duration in Topic State Sample Report
Topic Processing Time
| Description | Columns |
|---|---|
|
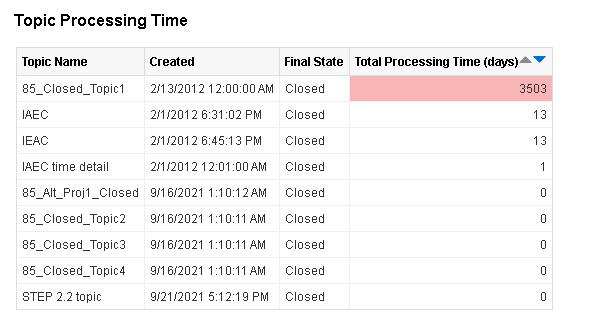
Calculates the duration in days from when a topic is created until the toic moves to the current final state. If Total Processing Time (days) is greater than 100 the cell is shaded light red. Sorted by Total Processing Time (days) . |
|
Topic Processing Time Sample Report
Topic Count by Topic State
| Description | Columns |
|---|---|
|
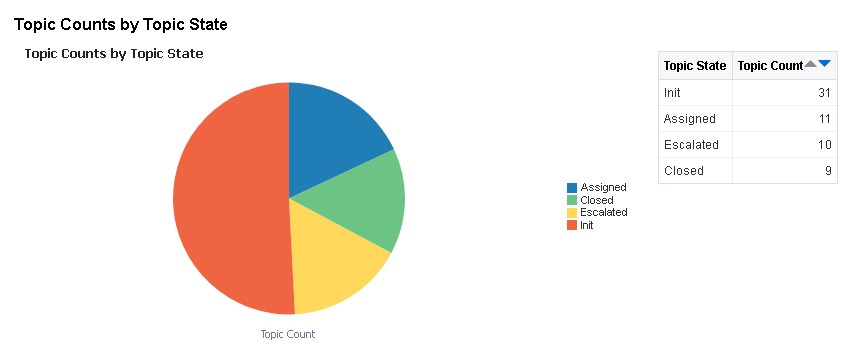
Provides the number of topics currently in each state. Sorted by Topic Count. |
|
Topic Count by Topic State Sample Report
Days in Current Topic States
| Description | Columns |
|---|---|
|
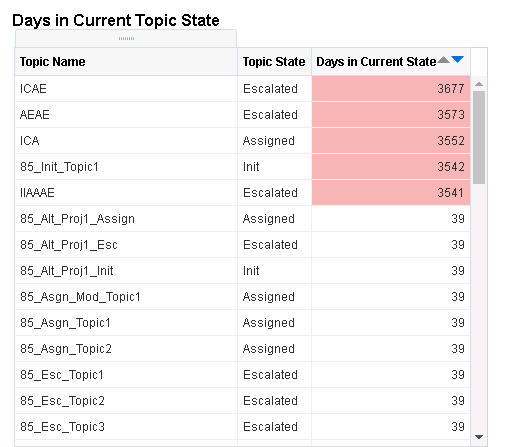
Provides the number of days since a topic transitioned into its current state. The report only includes open topics that are in a non-final state. Sorted by Days in current state. |
|
Days in Current Topic States Sample Report
Summary of Safety Signals Report
Note:
This report is available only if Oracle Analytics is configured to use the RPD model and the report catalog for the Sample GVP Module IX.- The topic's Topic name field is populated with a signaling term.
- The topic's Topic description field is populated with a brief summary of the rationale for further evaluation.
- The topic's Product name field is populated with a product
name.
If your signal configuration is associated with the GVP Module IX topic workflow configuration and the signal configuration’s Topic product field is set to the topic workflow configuration’s Product name field, then when you create a new topic using Submit Review the topic’s Product name field will be automatically populated.
| Description | Filters for Data Retrieval | Columns - Data souce |
|---|---|---|
|
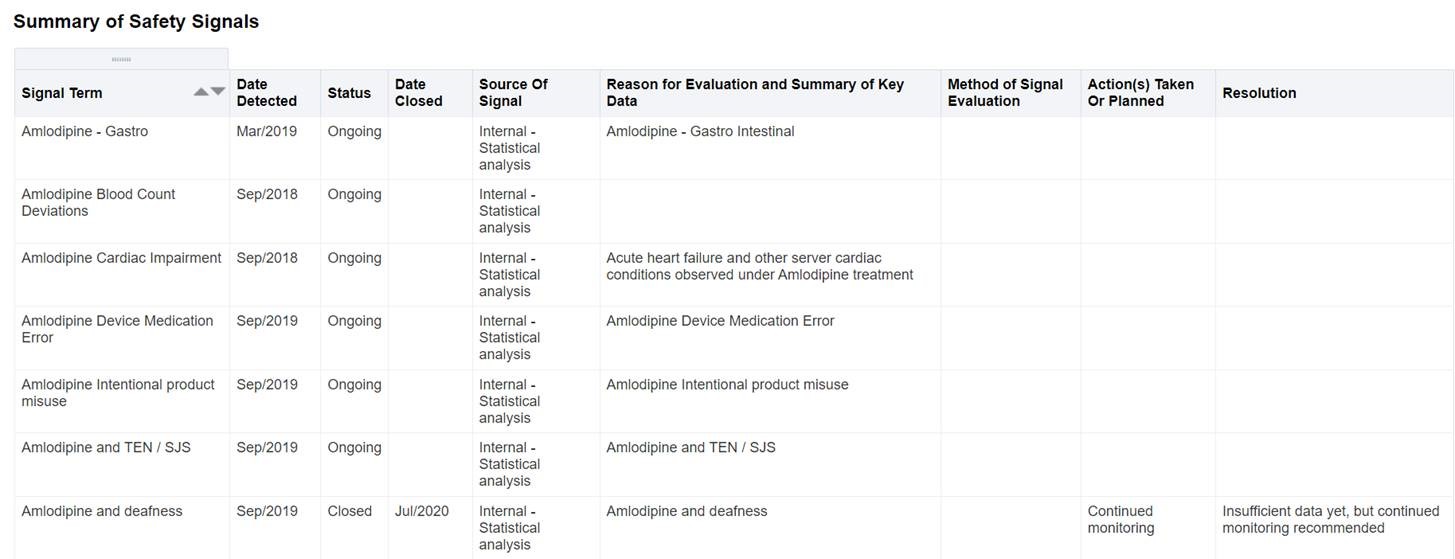
Tabular summary of safety signals ongoing or closed during the reporting interval. Sorted in order by Signal term. Note: The report reflects topic information as of the end of the reporting interval. |
|
|
Summary of Safety Signals Sample Report
Parent topic: Viewing topic reports