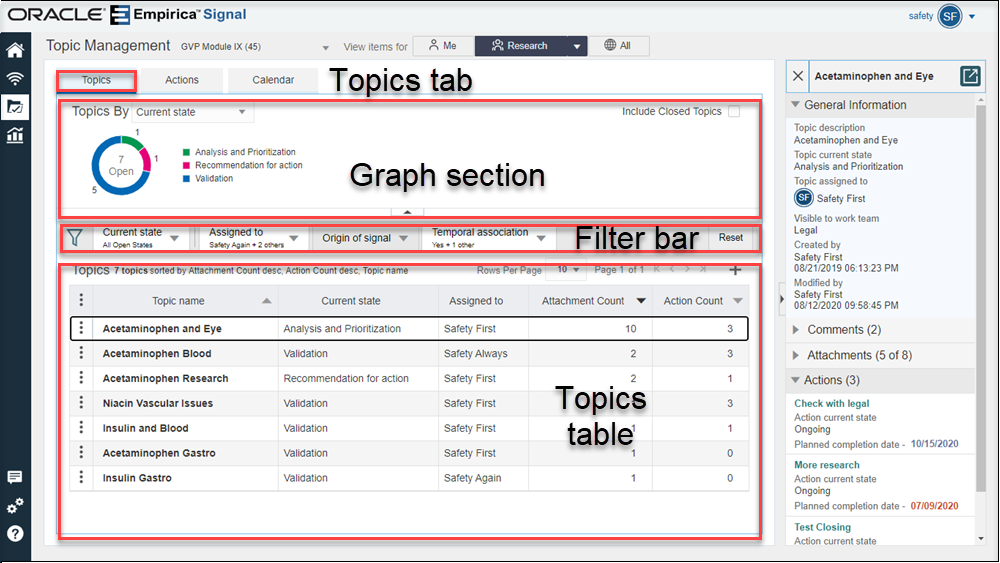
Sections of the Topics tab
The Topics tab of the Topic Management page provides information about existing topics. There are three sections.
In addition to the Title bar, containing the page title, Topic Workflow Configuration selector, and the View items for selectors, the three sections of the Topics tab are:
Figure 3-2 Sections of the Topics tab

Graph section
The Graph section on the Topics tab graphically displays summary information of topics. The Topics By drop-down list contains a list of filterable fields. The type of field determines if a bar chart or donut chart is displayed. A donut chart is a pie chart with a hole in the center that displays the total number of topics. The donut graph displays when you select Current State.
You can perform a number of tasks in the Graph section that impact what you see in the Graph section of the Topics tab.
- Make a selection from the Topics By drop-down list to graph the distribution of topics by this field. The graph displays counts (number of topics) for each value of the selected field. Data for which there is no value is displayed as (No Value). There is no impact on the content in the Topics table below.
- For most Topics By fields, a solid bar is displayed with a count for each topic with the field value. If the Topics By field is Assigned To and the value is a work team, the bar is not solid.
- If the Topics By selection is Current State, the states and number of topics for each state appears in a donut graph whose total area corresponds to 100%. If there are many states, you may want to remove some of the states with larger values to compare the states with smaller values. You can hide a state from the donut by clicking the box to the left of the name in the legend.
- Select or deselect the Include Closed Topics check box to include or exclude topics that have been closed in the Graph section. For bar charts, this adds a bar in a lighter color for any closed topics. If there are open and closed topics for the Topics By field, then a stacked bar is displayed. Hover over the two sections to see the breakdown of the total shown by closed versus open topics. If you have chosen Current State from the Topics By drop-down list and then select the Include Closed Topics check box, a second donut chart shows the closed topics.
- Hide or show the Graph section by clicking the up-arrow or down-arrow that appears at the bottom of the Graphic section, respectively.
- If you click any element in the Graph section, a menu opens with
two options:
- Add to filter: Add the filter to the Filter bar and filter the Topics table.
- Replace filter: Replace current filters on Filter bar with the graph selection and filter the Topics table.
Filter bar
- Click the Select Filter button (
 ) to add or remove filters. You can add as many filters as you want.
After you add the filter, you select values for the filter by clicking the
filter.
- Click the Reset button to clear the values of the selected filters and set the Current State filter to All Open States. The filters stay on the Filter bar; however, you can redefine the values for each filter.
- To remove filters from the Filter bar, uncheck the filter from the Select Filter menu.
Topics table
- The View items for selection and the filters in the Filter bar determine the set of topics shown.
- The Header Action menu (
 ) provides access to column management and download options, Oracle Business Intelligence Enterprise
Edition (OBIEE) topic reports, and allows you to add a topic to the table.
Note:
OBIEE topic reports are not available for customers that do not integrate with OBIEE. - The Row Action menu (
 ) provides the following options, whose availability depends on your
work team and user permissions, and the topic state.
Row Action menu options and permissions
Row Action menu option Work team permission View
View Topics/Actions/Attachments (or user has View Topics across Work Teams user permission).
Edit
Edit Topics/Actions.
Delete
Delete Topics/Actions.
Reopen
Reopen Topics/Actions (Topic is in a final state and the topic workflow configuration supports a transition from this final state.).
Create PDF
Create a Portable Document Format (.pdf) version of the table for downloading.
Create ZIP
Create a compressed .zip file (which contains a .pdf file) version of the table for downloading.
Parent topic: Use Oracle Empirica Topics