2.2 Dashboard Organization
This topic explains about the dashboard organization.
Oracle Banking Trade facilitates integration of Information from multiple products
and displays it as Dashboard on the home page, also called the landing page of the
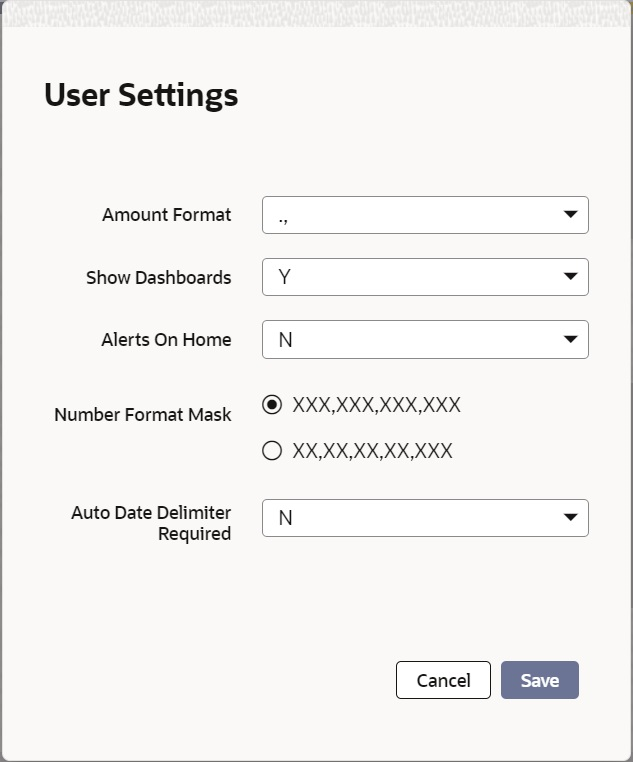
application; however, you can view these dashboards, only if the ‘Show
Dashboard’ field value is maintained as ‘Y’ at the ‘User
Settings’ level.
Description of the illustration 2.2_user-settings.png
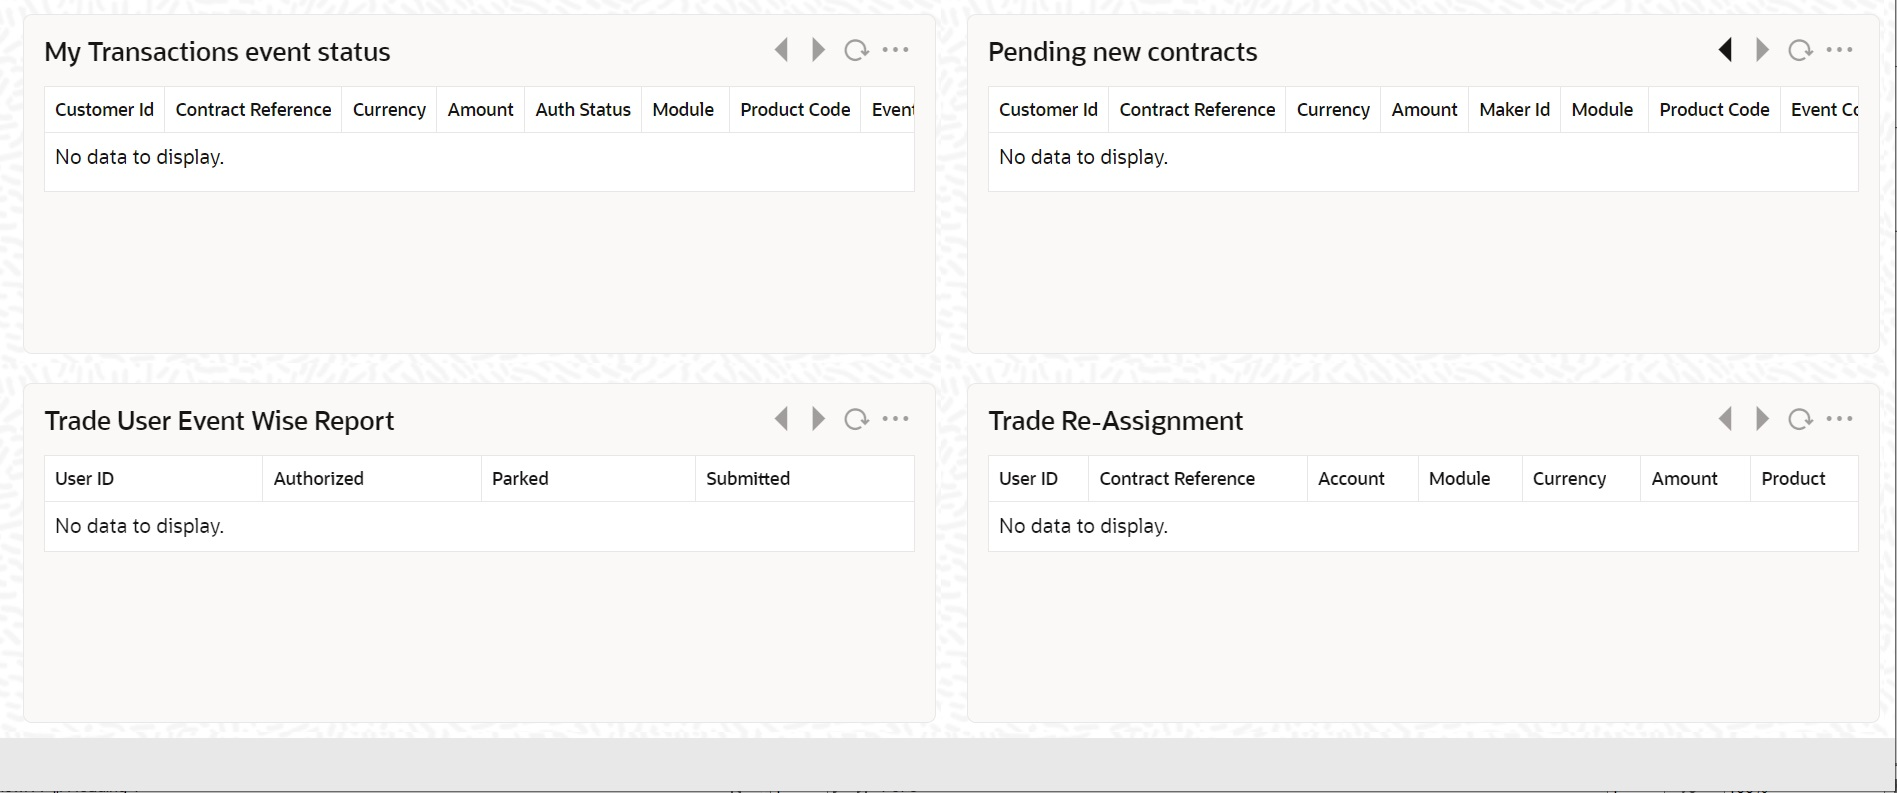
Oracle Banking Trade Finance organizes Dashboards to provide comprehensive and consolidate snapshot in tiny windows, to access information easily. Thus, helping the bank staff to; analyze, monitor, and make better decisions which in turn help save time and cost.
Landing page is designed to display six Dashboards distributed in three rows with
two Dashboards per row, without vertical scroll bar.
 and
and  are available to move to the previous and next page respectively. Click
 to refresh all the Dashboards displayed on the landing page.
Note:
If less than six Dashboards are mapped, then the unfilled frames are blank. If more than six Dashboards are mapped,The height and width of all Dashboards are fixed; however, the number of columns per Dashboard varies based on the size and name of the columns specified at Dashboard design level. Since the height of each Dashboard is fixed, only the first 5 records can be viewed at a time. If the Dashboard contains more than 5 records, then the following buttons and links at the top of each Dashboard aid in viewing them:
The following hyperlink facilities are also available in each Dashboard:
You can map any number of Dashboard function IDs (DFI) to a specific ‘Role’ or ‘User’ at Role Mapping and Dashboard Mapping level. If DFIs are mapped at ‘Dashboard Mapping’ level, then to enable Dashboards you need to map the corresponding functions/assigned roles at ‘Role Mapping’ level. You can also specify sequence order of DFIs at ‘Dashboard Mapping’ level, however, you can specify the same at ‘Role Mapping’ level. If multiple roles are added and the sequence is not specified, then the system will sort and display the DFIs alphabetically. If DFIs are mapped to ‘User’, then you can specify the display order for each DFI individually.
| Button/Link | Functionality |
|---|---|
| Previous | Click the button to view the previous set of 5 records. |
| Next | Click the button to view the next set of records. However, if there are more than 5 entries then only the next five can be viewed. |
| Refresh | Click the button to manually refresh and view the first five records. |
| More | Click this link to launch a screen with more information similar to that of the current Dashboard. |
- Column-wise link – Each column in the Dashboard can be mapped to a different Function ID to provide column-wise hyperlinks. Click the hyperlink in a particular column to launch the corresponding Function ID. A link to a particular column is limited only to that column.
- Row wise link – Each row in the Dashboard can be mapped to a different Function ID to provide row-wise hyperlinks. Click the hyperlink in a particular row to launch the corresponding Function ID. A link to a particular row is the same across all fields in that row.
Note:
Hyperlinked rows and columns are highlighted to distinguish them from others. When a row/column link is clicked, the clicked row/column gets highlighted respectively.