4.1 Log Analysis
This topic describes the possible issues to use logs to analyze issues in a transaction using logs.
Error Message not shown
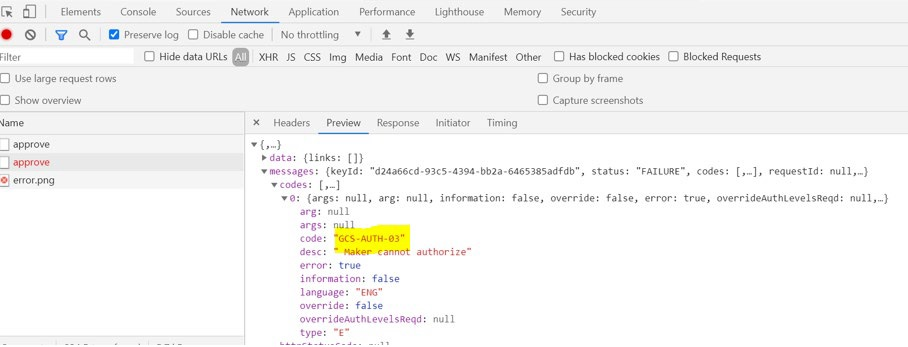
If there are any improper calls, check the ERTB_MSGS table of the respective schema to understand the cause of the error.
- Press F12 to open the Networks.
- Check the error code in the response.
Query: SELECT * FROM ERTB_MSGS WHERE ERR_CODE=’GCS_AUTH-03’
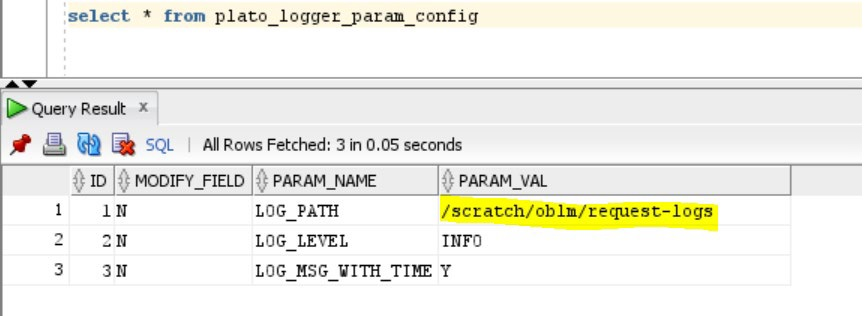
Setting Log file path
Log generation path needs to be defined in PLATO_LOGGER_PARAM_CONFIG table of PLATO schema.
Query: Select * from PLATO_LOGGER_PARAM_CONFIG;
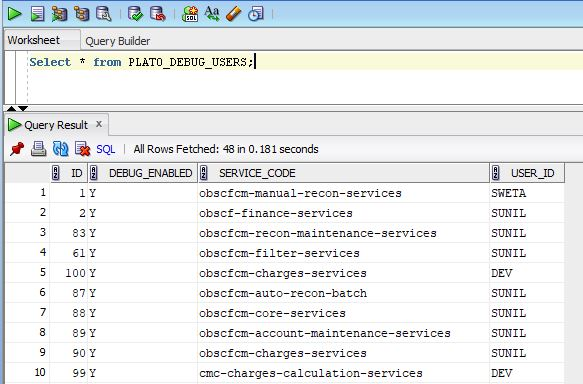
Dynamic Log Generation Issues
Query: Select * from PLATO_DEBUG_USERS;
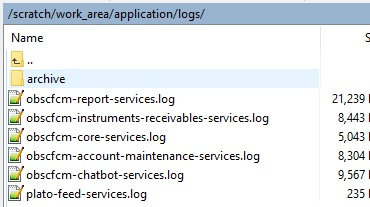
Logs are not generated
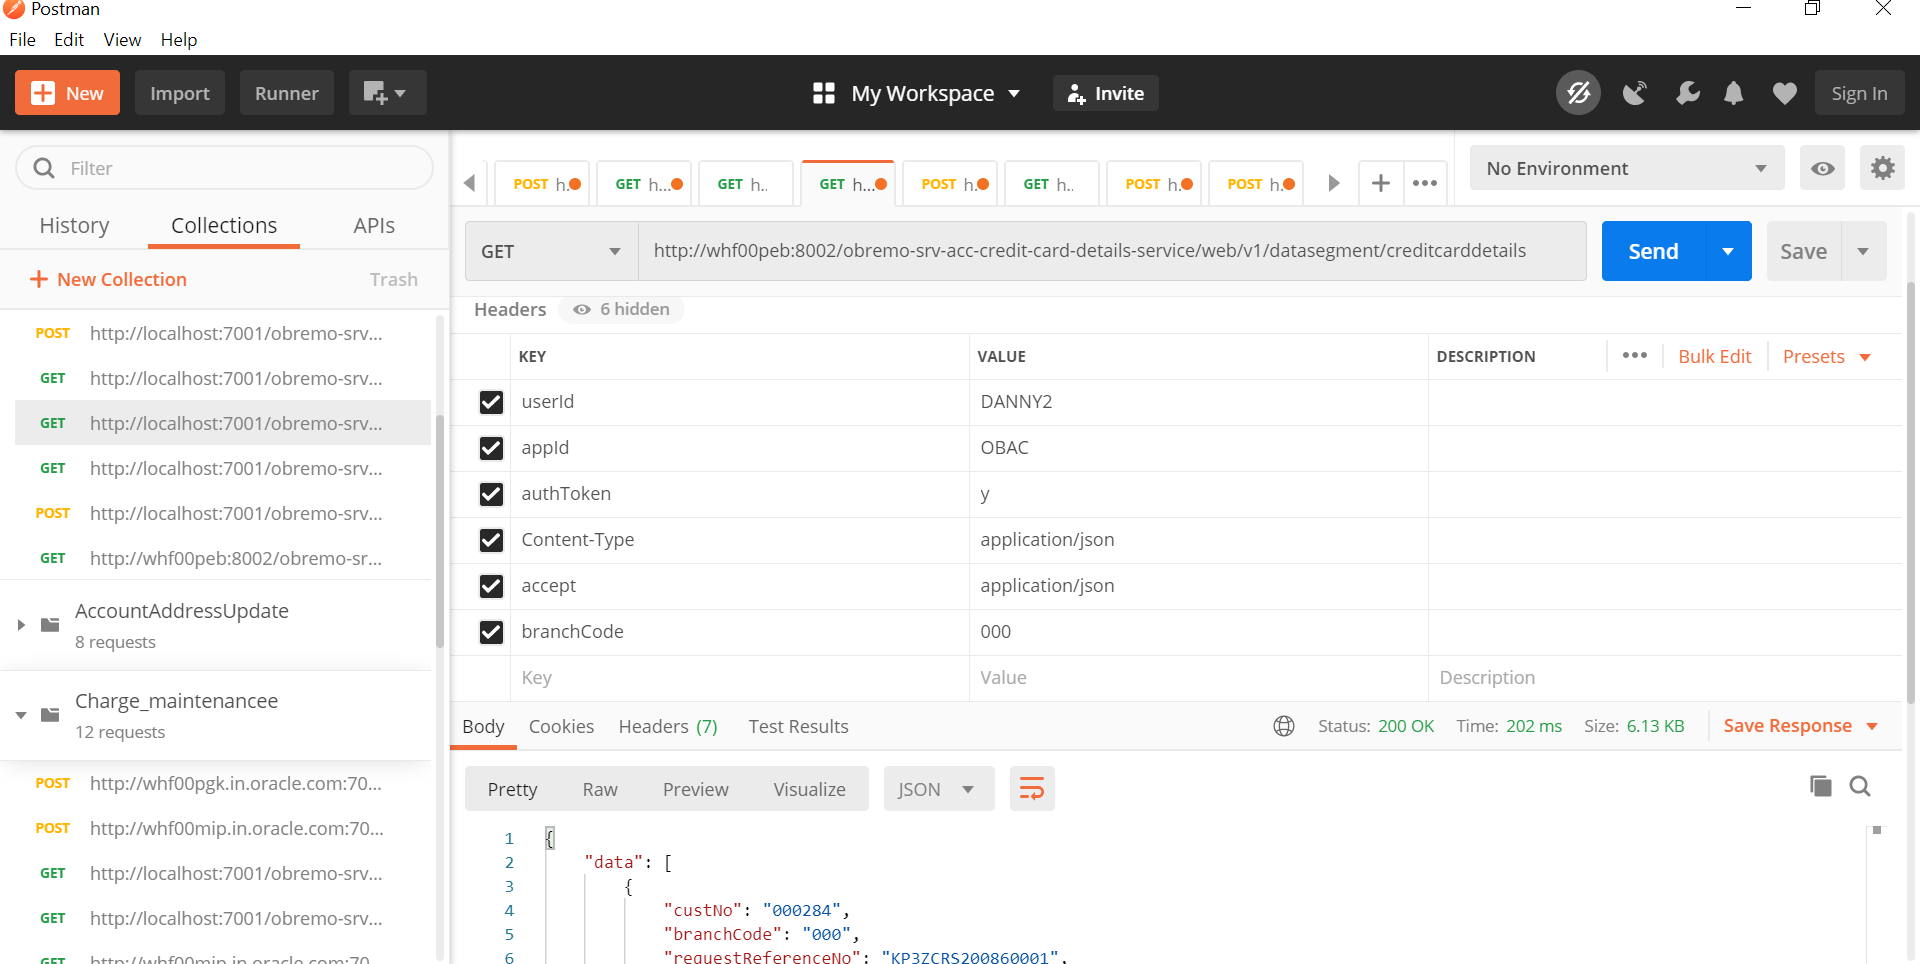
If you are not getting logs, put the loggers across API, hit through postman, and test again.
404 Error
The possible causes for 404 error are as follows:
- Check service is not running on Eureka
- Check service is not deployed in WebLogic
500 Internal Error
The possible causes for 500 internal error are as follows:
- Issue with Plato entries
- Issue with Eureka
- Issue with any peace of code
Menu Missing/Functional Activity Issues
403 Error - User Role issuesMake sure that the required Role and User Applications are mapped to the user. Refer Security Management System User Guide to create Role/User.
Dashboard Issues
Dashboard not loading
User access is one of the reasons if you are not able to view the Data in the Dashboard. Make sure that the required Role and User Applications are mapped to the user. Refer Security Management System User Guide to create Role/User.
Improper display of data in the Dashboard- Examine the report logs of OBSCF/OBSCFCM for more information.
- Restart the Report services or Kafka, if they are down.
- Verify that the Currency is maintained correctly.
- If there are technical problems, additional analysis is necessary.
Parent topic: Troubleshooting Functional Workflows
