- Troubleshooting Guide
- Troubleshooting Technical Flows
- Login to Zipkin
1.4 Login to Zipkin
This topic describes the systematic instructions to troubleshoot the errors using the Zipkin Traces.
- Launch the Zipkin URL.
Note:
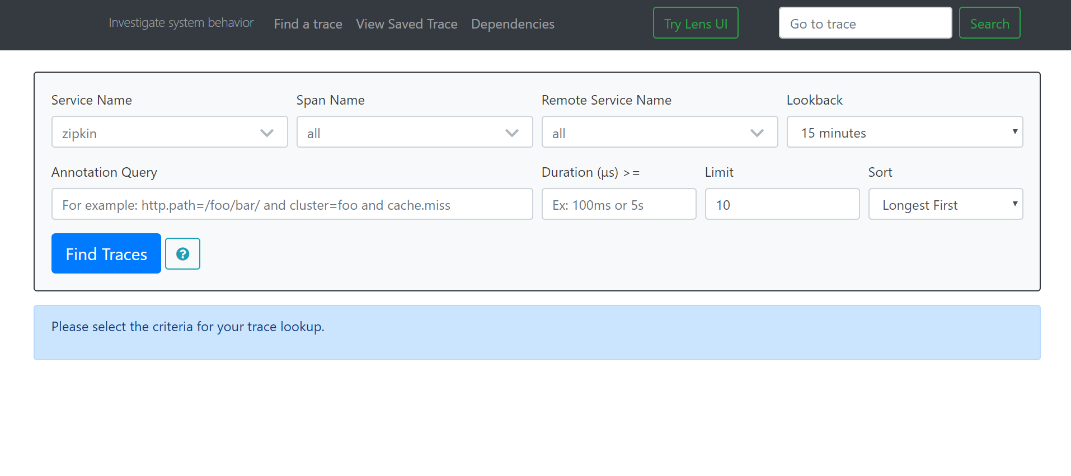
The basic layout of Zipkin displays. - Use Search to find the traces of required API calls and services.
Note:
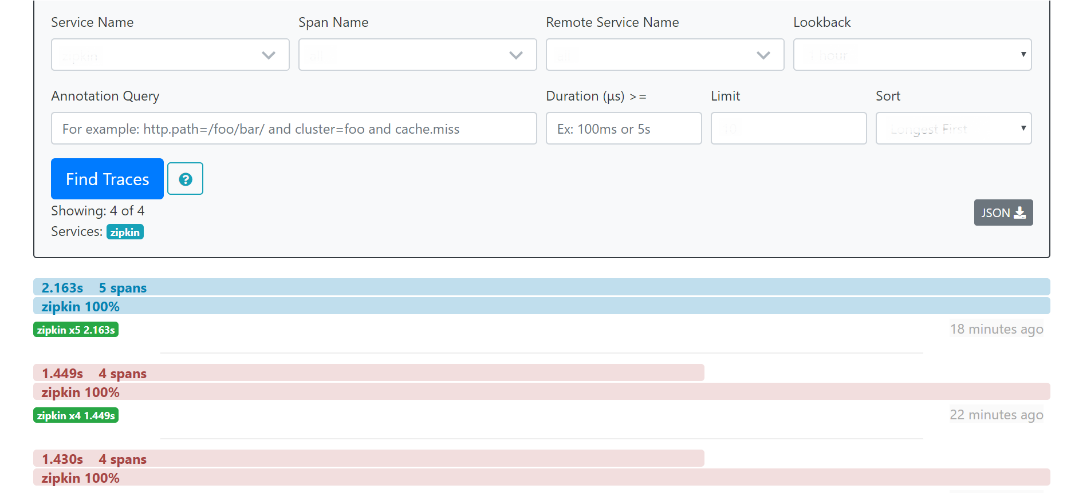
The search options given in the user interface are self-explanatory, and there is another UI option (Try Lens UI). It is given a different user interface with the same functionality.Some error API calls are made to showcase how to track errors. The blue listing shows the successful API hits, and the red listing indicates the errors. Each block indicates a single trace in the listing. The below figure shows the list of traces.
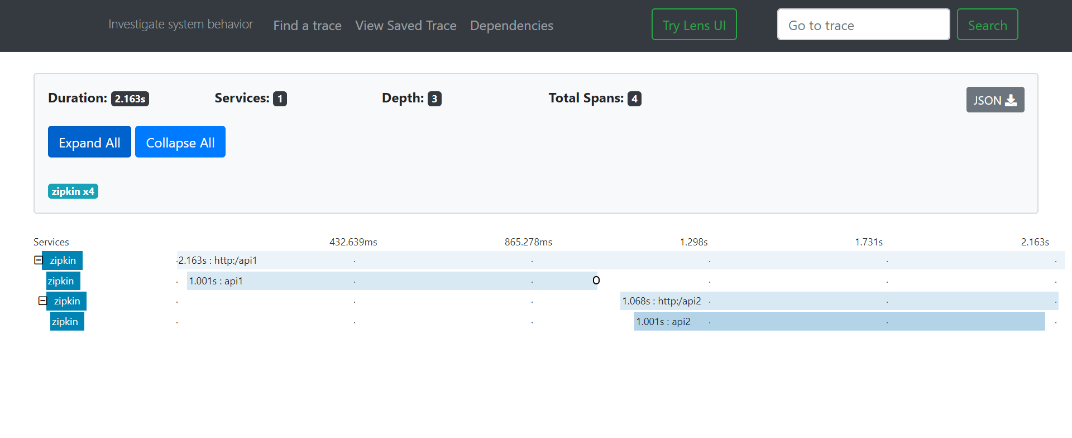
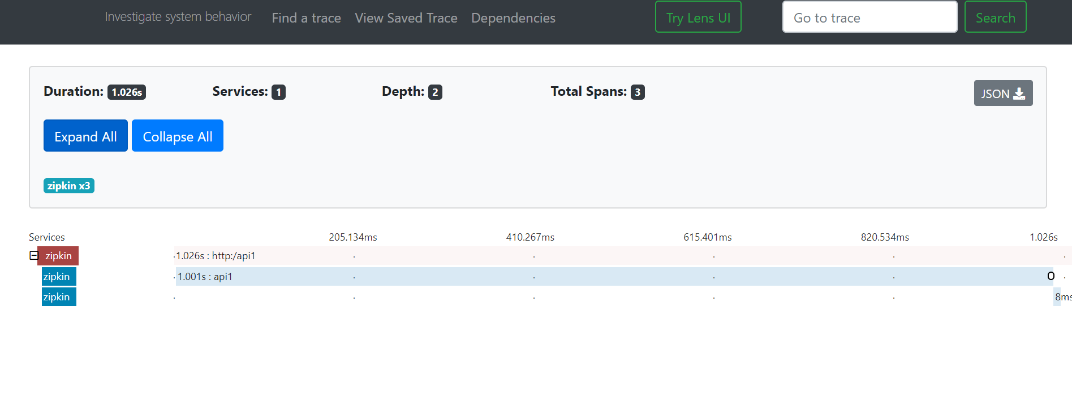
- Open the individual trace.It describes the time taken for each block. As the two custom spans are created inside two service calls, user can find a total of four blocks.The time taken for an individual block is shown below.The details of an individual trace displays.
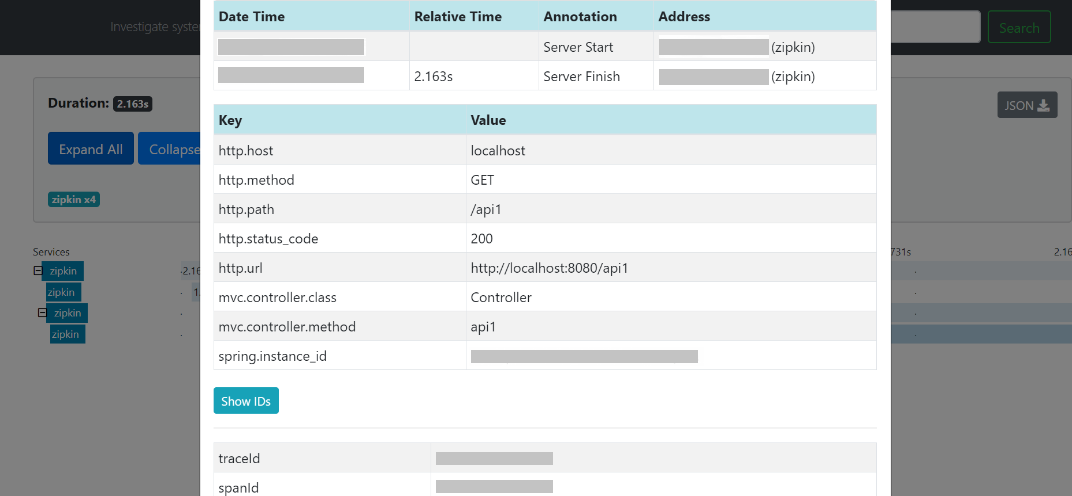
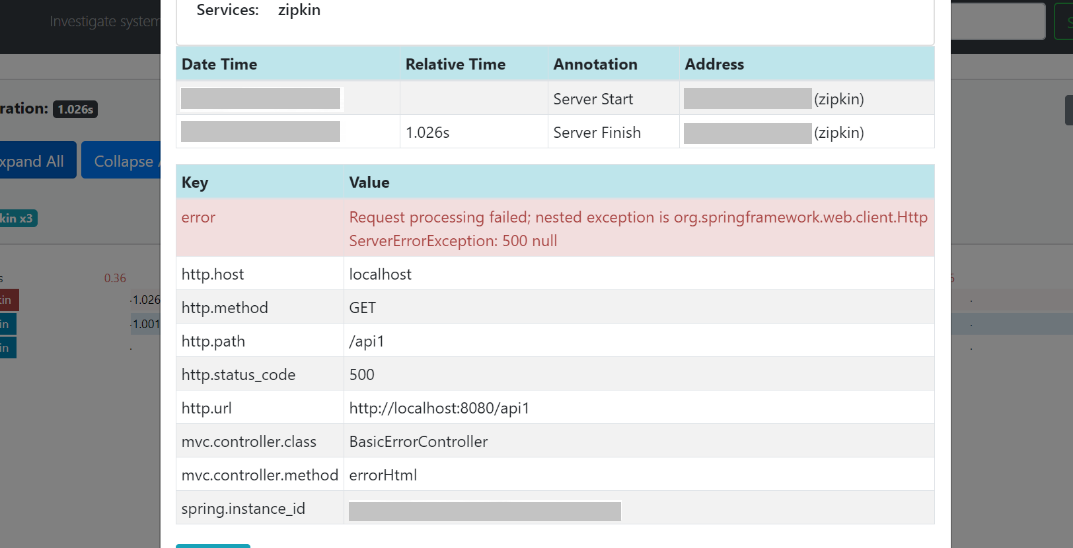
- Click on the individual block to display the details.
The user can also view the logging events in the Zipkin UI as small circular blocks. An example of an error log is shown below.
- Click the error to get clear details and place of the error.
Note:
If the Lens UI is used in Zipkin, the above figures are not applicable but are relatable to the Lens UI as well. Traces of the application can be found using TraceId. The TraceId can be found in the debug logs of the deployment whenspring-cloud-sleuthis included in the dependencies (included inspring-cloud-starter-zipkindependency). - Click the Dependencies to get the dependency graph
information between micro-services.
Parent topic: Troubleshooting Technical Flows
