2.2.3 Processing Summary
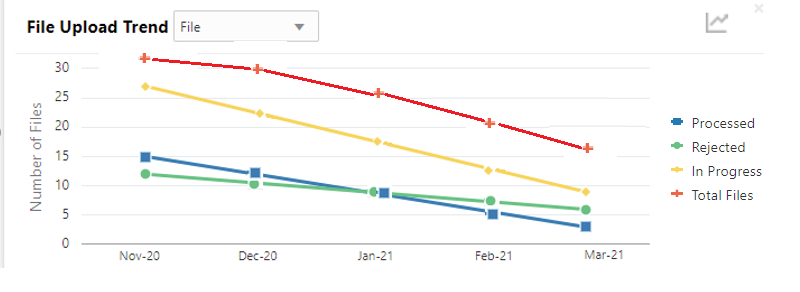
This widget displays the total files uploaded by the corporate user using Oracle Banking Electronic Data Exchange for Corporates platform in the past six months. The count of processed and rejected files for each month is displayed in a bar chart or line graph. A sample of the upload summary:
Figure 2-8 Upload Summary
The following details are displayed in the widget:
- Bar chart representing the count of files uploaded by corporates
- Bar charts showing monthly count of Processed, Rejected, In Progress files in the past six months
The Bank user can perform following actions on the Upload Summary widget:
User can drill down his search to view the Total Record count that has been received by Oracle Banking Electronic Data Exchange for Corporates platform for processing within file, with status of either processed or rejected.
- On click of the graph button at the top-right views, File Upload trend with Line graph will be displayed, which represents the data as a line, as a series of data points, or as data points that are connected by a line. The Line graph will indicates the total number of files count across Y-axis and last 6 months details at X-axis. The graph represent total number files that have been received with respect to processed and rejected status.
Parent topic: Dashboard

