2 Investments Overview
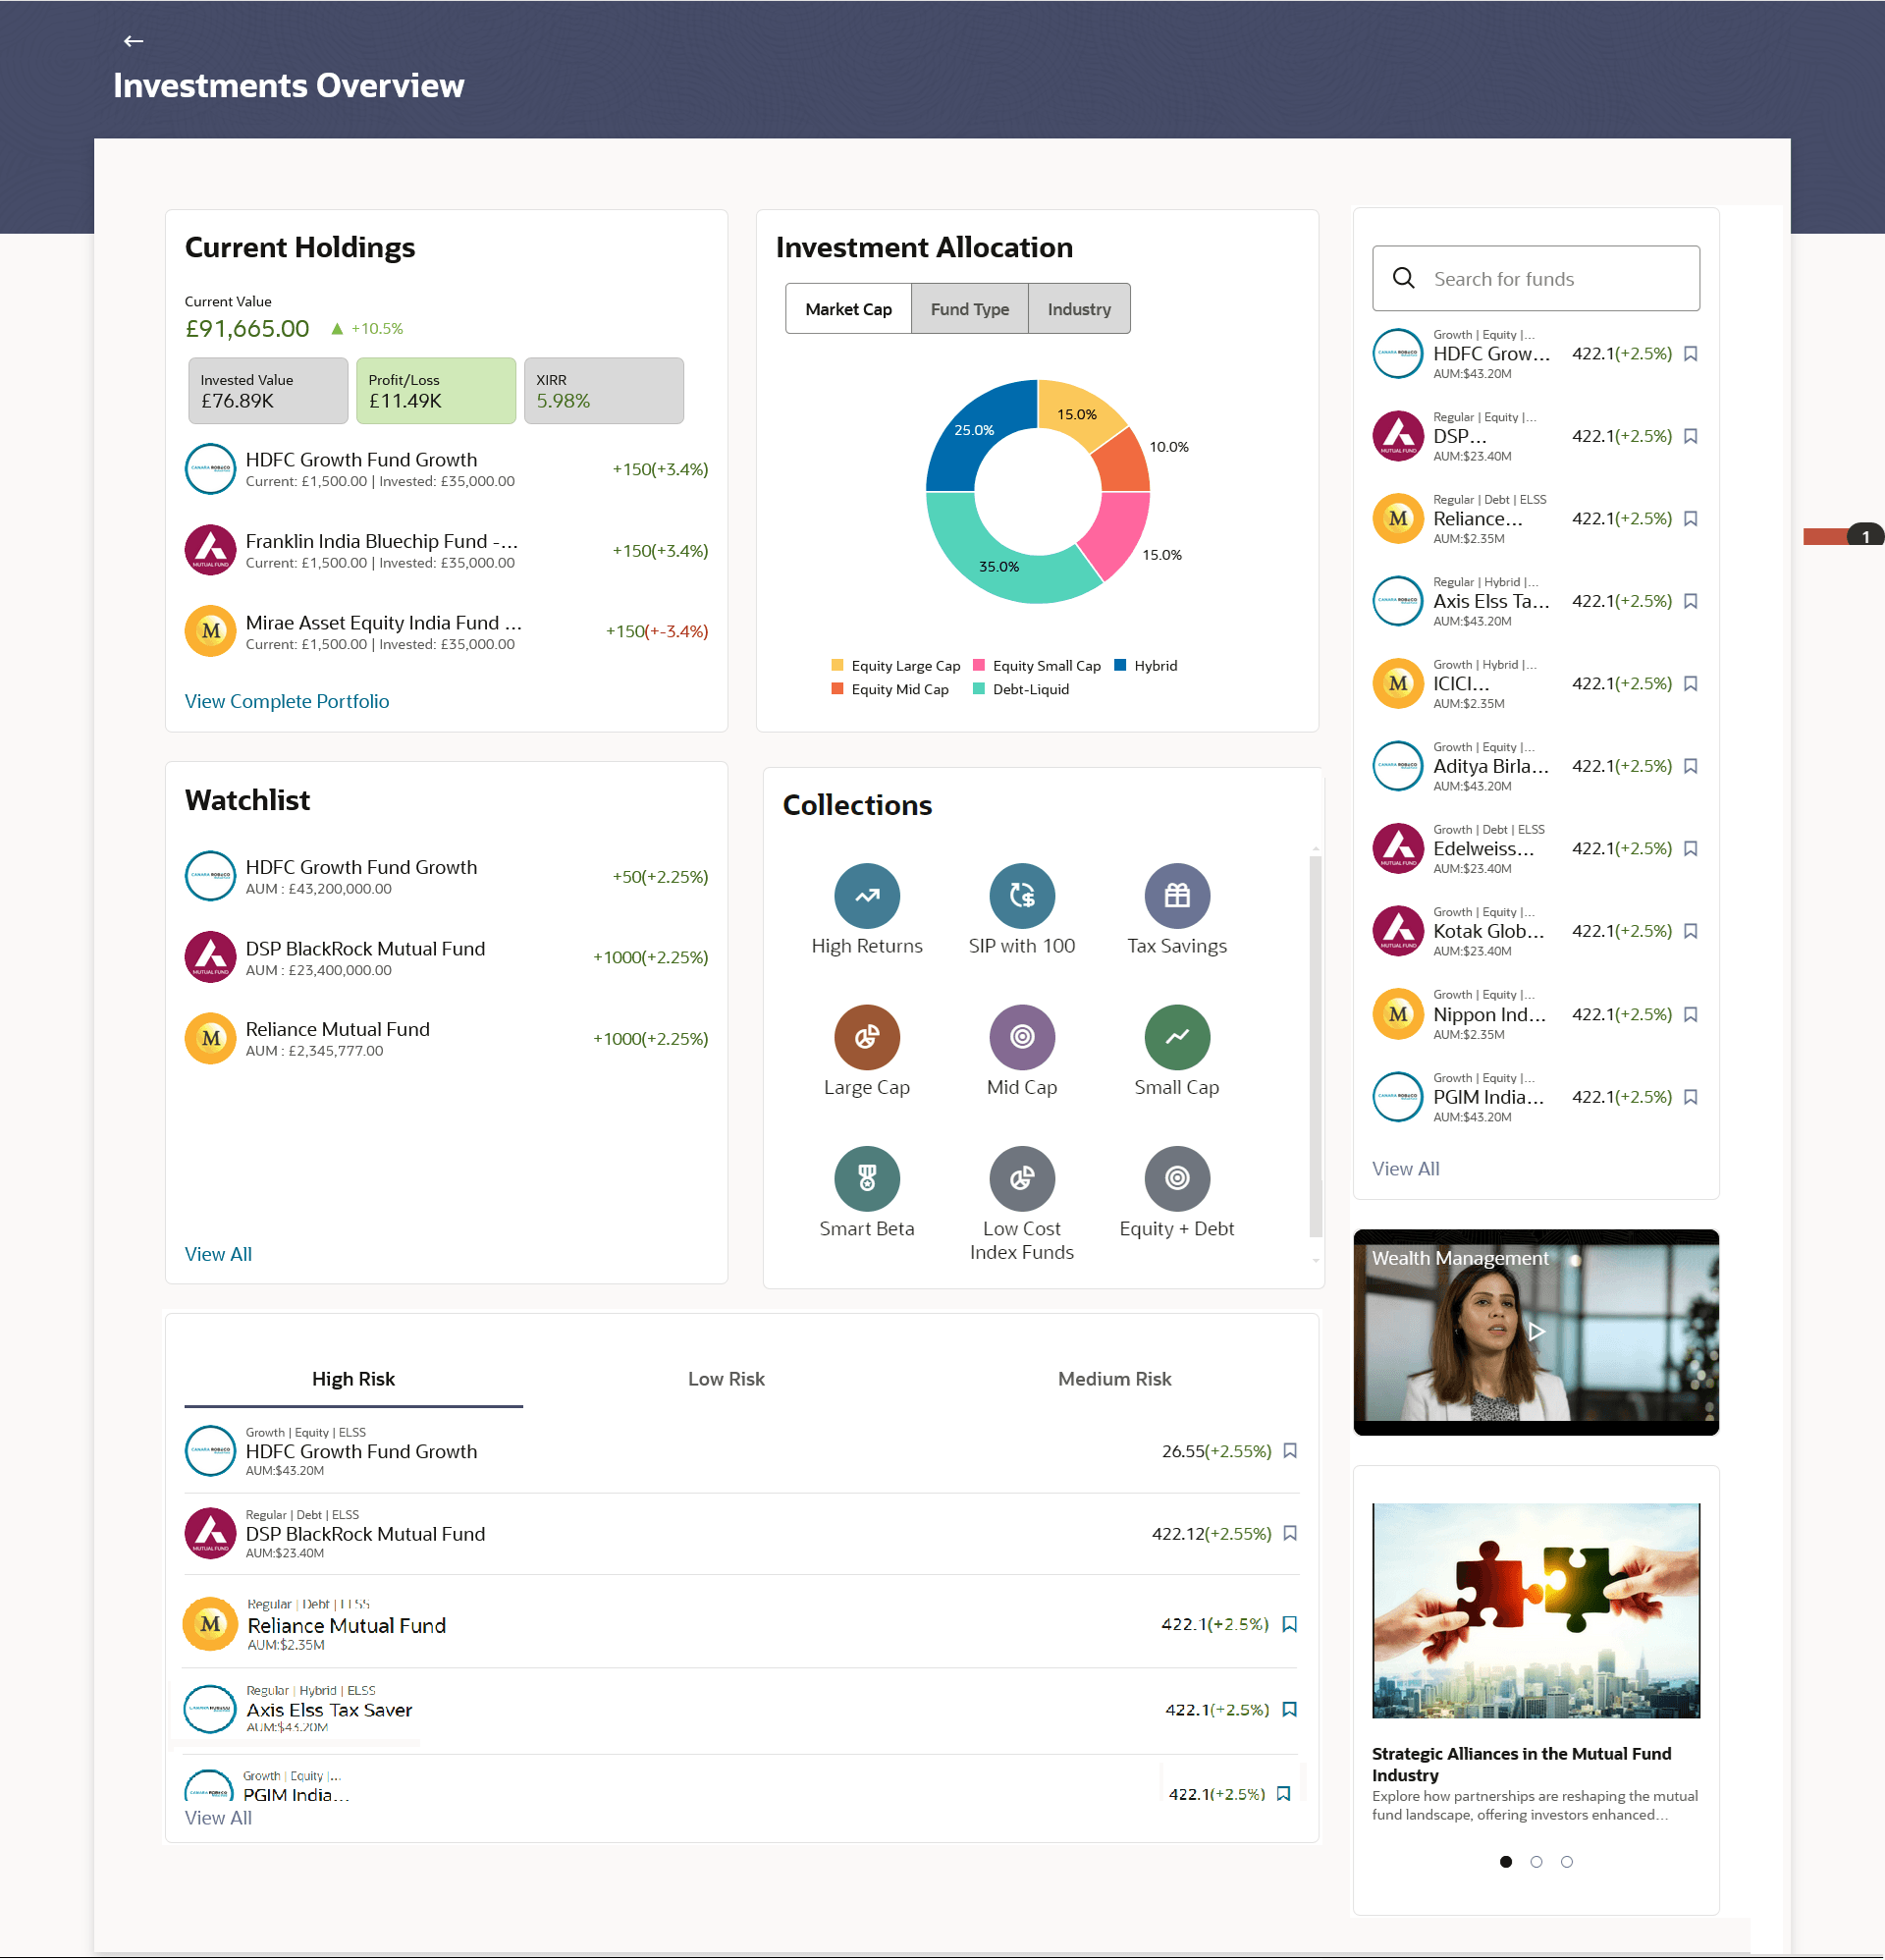
This topic describes the information about Investments Overview screen. Wealth Management overview provides a snapshot of mutual fund portfolio at a given point of time.
The overview/ dashboard page displays an overview of the customer’s investments with the bank as well as quick links to various wealth management transactions offered to the customer.
Note:
- If there has been a profit since the previous day, the amount will be displayed in green with a triangle pointed upwards in Green.
- If there has been a loss since the previous day, the amount will be displayed in red with a triangle pointed downwards in Red.
Navigation Path:
Perform anyone of the following navigation to access the Overview screen.
- From the Dashboard, click Toggle menu, and then click Menu, then click Financial Management . Under Financial Management , then click Wealth Management , and then click Overview .
- From the Search bar, click Wealth Management - Wealth Management Overview.
Investments Overview
The Wealth management Overview screen features the following:
Current Holdings widget
This widget allows the user to view the invested value, current value, and individual profit/loss for each product. It shows details of user’s current holdings in Mutual Funds.
This widget allows the user to view the following:
- Total money invested in Mutual Funds.
- Current market value of the investments done.
- Change in the market value of investments over previous value, if the change is positive it will be in Green color and Red color if change is negative.
- Profit/ Loss amount for the above investments.
- Change in the profits figure over previous value, if the change is positive it will be in Green color and Red color if change is negative.
- XIRR- Rate of return in percentage for the investments.
- Change in rate of returns figure over previous value, if the change is positive it will be in Green color and Red color if change is negative.
- The realized gain/ loss figure for the investments.
Click on the View Complete Portfolio link to view the investment details. This redirects to the Investment Details screen.
Investment Allocation widget
The investor/ user can view the detailed summary of all the investment accounts.
Doughnut chart displays the distribution of investment basis various fund categories along with the legends. Similarly, hovering the mouse over a category on the doughnut chart, the user can view details for each category. The investment allocation is visible based on three different categories:
- Market Cap – Can view user’s investment allocation graph as per the market capitalization. The bifurcation is amongst Large Cap, Mid Cap and Small Cap. The investment details are split and shown based on whether it falls within large, mid or small market capitalization.
- Fund Type – Can view user’s investment allocation graph as per the type of fund. The bifurcation is amongst Equity Funds, Debt Funds, Hybrid Funds etc. The investment details are split and shown based on whether it falls within the specific type of fund.
- Industry – Can view user’s investment allocation graph as per the industry. The bifurcation is amongst the various industries like Finance, IT, Energy etc. The investment details are split and shown based on whether it falls within specific industry.
Search Funds widget
This widget allows investor/ user to search for funds based on the asset name. It lists all the top performing funds on top followed by the other funds. Each fund shows details like Category, Asset Name, AUM Value, NAV (%), Watchlist Option. The user can select a particular fund and add it to his/her watchlist by selecting the watchlist option. On watchlisting a specific fund, the fund is added in the Watchlist Funds widget.
Click on the View All link to view all the funds.
Watch list widget
This widget allows user to view the funds watch listed by him/her from the search funds widget. On watch listing a specific fund, the fund is added in the Watch list Funds widget. Click on the View All link which will navigate to another screen where all the funds listed.
News widget
This widget shows market-related news, which is reflects current market trends. Users can also watch a video that provides a basic understanding of mutual funds; click the video to play it.
Collections widget
This widget shows all the mutual funds grouped by different categories. The mutual funds are clubbed and shown based on the below parameters:
- High Returns
- SIP with $100 (currency to change with the user currency)
- Tax Saving
- Large Cap
- Mid Cap
- Low-Cost Index Funds
- Small Cap
- Smart Beta (Smart Beta funds are a type of exchange-traded fund (ETF) that aims to outperform traditional index funds)
- Equity+Debt
Click on any fund category options, it will re-direct to the Purchase Mutual Fund page.
Risk Categorized Funds (High Risk, Low Risk, Medium Risk) widget
This widget displays mutual funds grouped by the risk associated with it. The widget groups mutual funds into Low, Medium, and High-Risk categories. Against each fund within the risk categorized funds, click on the (watchlist) option to add the selected fund to the user's watchlist. For each fund, the following details must be displayed:
- Categories- High Risk, Low Risk, Medium Risk
- Fund Name – name of the fund
- AUM Value - total market value of all the assets in mutual fund
- NAV in Percentage - total value of the fund's assets per unit in percentage
Click on the View All link to view all the funds.
