Understanding Root Cause Analysis
Learn about how Oracle Communications Unified Assurance performs root cause analysis (RCA) on fault events. RCA is performed using a microservice to automatically correlate network outages with related events, which can help you identify and resolve the root cause of an outage rather than focusing on individual symptoms.
About Root Cause Analysis
The device discovery process includes setting up SNMP and ping pollers to discover devices. After devices have been discovered, the pollers periodically poll discovered devices for availability and the RCA Availability Engine microservice periodically loads an indexed topology of the entire network from the Graph database. When pollers detect that a device is down, RCA checks the overall network topology to identify where the outage originated, such as a related interface being down, and any other symptoms, such as outages in other devices, interfaces, BGP sessions, and OSPF neighbors. After determining the root cause, RCA enriches the event with the root cause and symptom information, then submits it to the event collection topic to be processed and eventually inserted into the Event database. You can then see the root cause and additional symptom events in the Unified Assurance user interface.
Root Cause Analysis Flow
The following image shows the RCA flow, from the time a device goes down to the event being added to the Event database.
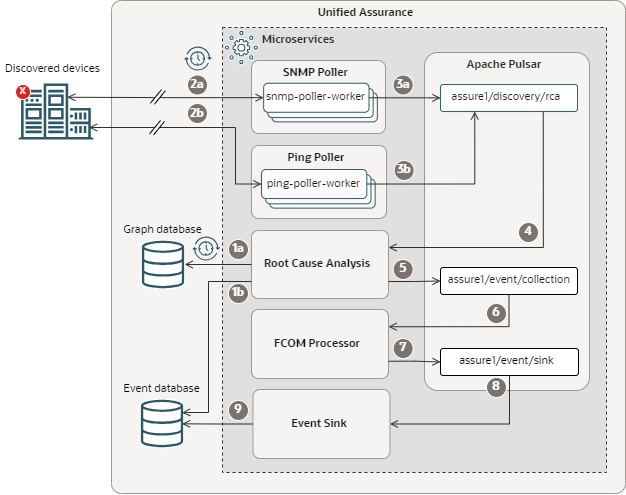
Description of illustration rca-flow.png
The flow is as follows:
-
When the RCA Availability Engine microservice starts up, it gets:
- The current network topology from the Graph database. It repeats this to get the latest topology at a configured interval.
- Device, interface, BGP session, and OSPF neighbor status from the Event database.
-
At configured intervals, SNMP and Ping poller workers poll discovered devices for status and get responses that indicate devices, interfaces, BGP sessions, or OSPF neighbors are down.
-
The poller workers publish events with the following data to the assure1/discovery/rca Apache Pulsar topic:
-
Availability data
-
Device status
-
Instance administration status, which shows whether the device is enabled or not.
-
Operational status for SNMP requests, which shows whether the interface formed a link or not.
-
-
The RCA Availability Engine microservice, which is subscribed to the assure1/discovery/rca topic, picks up the events and sends acknowledgments back to the topic.
-
After two subsequent device down events for the same device, the RCA Availability Engine microservice:
-
Correlates the outage with a root cause by looking at the network topology retrieved from the Graph database to find other related outages.
-
Enriches the event with the root cause and symptom information.
-
Publishes the event to the assure1/event/collection topic.
-
-
The FCOM Processor microservice, which is subscribed to the assure1/event/collection topic, picks up the events and sends acknowledgments back to the topic.
-
The FCOM Processor microservice normalizes the events and publishes them to the assure1/event/sink topic.
-
The Event Sink microservice, which is subscribed to the assure1/event/sink topic, picks up the events and sends acknowledgments back to the topic.
-
The Event Sink microservice adds the events to the Event database.
A Unified Assurance user investigating the outage in the user interface can then use the root cause information for the event to identify and resolve the correlated upstream problem.
Root Causes
RCA includes default root cause events. Most events are generated after two poll cycles, but flapping events (where the status alternates, or flaps, between up and down) are generated based on the maximum number of stored availability states. The events clear after one poll cycle with an up status.
There are three types of root cause event:
-
Standalone: A single device, BGP session, OSPF neighbor, or interface that is unavailable when no other connected devices are down. This can also be generated for devices with no RCA correlation.
-
Root: The device that is the cause of other device outages.
-
Symptom: Devices that are unreachable, or BGP sessions, OSPF neighbors, or interfaces that are unavailable because of another device outage.
This table describes the default root cause events.
| Event Type | Event Level | Description |
|---|---|---|
| Device Down | Root or standalone | The node is down. If it's a root node, it may be the cause of other outages. Generated after two poll cycles with the device being unreachable. If multiple devices could be the root, the device with higher priority, as specified in RCA_Priority, is selected. A lower value means higher priority. |
| Isolated Segment | Root | The device is at the edge of a subgraph with no connected available devices. Generated after two poll cycles with the device being unreachable with no connected available devices. If multiple devices could be the root, the device with higher priority, as specified in RCA_Priority, is selected. A lower value means higher priority. |
| Device Unreachable | Symptom | The node is unreachable because its root is down or the root is an isolated segment. Generated after two poll cycles with a device being unreachable when it is within the path to a root. |
| BGP Session Down | Symptom or standalone | The BGP session is down. Generated after two poll cycles with a BGP peer state value other than established. |
| BGP Peer Missing | Symptom or standalone | The poller cannot reach a BGP peer that exists in the network topology. Generated after two poll cycles of the peer being unreachable. This can occur if the peer has been removed from your network, but the associated device has not been updated in the Unified Assurance topology. |
| BGP Session Disabled | Symptom or standalone | The BGP session is disabled. Generated after two poll cycles with a BGP session admin status of stop. |
| BGP Session Flapping | Symptom or standalone | The BGP session is flapping. Generated when the BGP session is fluctuating between up and down for all of its stored history. |
| OSPF Neighbor State Down | Symptom or standalone | The OSPF neighbor state is down. Generated after two poll cycles with the OSPF neighbor state value other than full. |
| OSPF Neighbor Missing | Symptom or standalone | The poller cannot reach an OSPF neighbor that exists in the network topology. Generated after two poll cycles of the OSPF neighbor being unreachable. This can occur if the OSPF neighbor has been removed from your network, but the associated device has not been updated in the Unified Assurance topology. |
| OSPF Neighbor State Flapping | Symptom or standalone | The OSPF neighbor state is flapping. Generated when the OSPF neighbor state is fluctuating between up and down for all of its stored history. |
| Entity Down | Symptom or standalone | The entity is down. Generated after two poll cycles with all interfaces on an entity in a down or disabled status. |
| Entity Missing | Symptom or standalone | The poller cannot reach an entity that exists in the network topology. Generated after two poll cycles of the entity being unreachable. This can occur if the entity has been removed from your network, but the associated device has not been updated in the Unified Assurance topology. |
| Interface Down | Symptom or standalone | The interface is down. Generated after two poll cycles with the interface's ifOperStatus of down. |
| Interface Disabled | Symptom or standalone | The interface is disabled. Generated after two poll cycles with the interface's ifAdminStatus of down. |
| Interface Missing | Symptom or standalone | The poller cannot reach an interface that exists in the network topology. Generated after two poll cycles of the interface being unreachable. This can occur if the interface has been removed from your network, but the associated device has not been updated in the Unified Assurance topology. |
| Interface Flapping | Symptom or standalone | The interface is flapping. Generated when the interface is fluctuating between up and down between polls for all of its stored history. |
| ICMP Unreachable | Standalone | The device is unreachable over ICMP. Generated after two poll cycles with the device unreachable over ICMP but reachable by another method. |
| SNMP Unreachable | Standalone | The device is unreachable over SNMP. Generated after two poll cycles with the device unreachable over SNMP but reachable by another method. |
| vCenter Unreachable | Standalone | Generated after two poll cycles with the device unreachable over vCenter API Polling but reachable by another method. |
You can get more information about the events, including severity and event message text in the DEFAULT-RCA.json file. To find the file:
-
In a browser, log in to the Unified Assurance UI.
-
From the Configuration menu, select Rules.
-
Expand the following folders:
Core Rules (core)/Default read-write branch (default)/processing/event/fcom/_objects/rca
-
Open DEFAULT-RCA.json to see the rules.
Timing Intervals
RCA depends on the following timing intervals:
-
TOPO_RESYNC_INTERVAL: Every 1800 seconds, RCA polls the Graph database for the latest network topology.
-
SMOOTHING_INTERVAL: Every 70 seconds, RCA checks the events received to determine whether to run root cause analysis or to clear events.
You can change the default settings for the RCA intervals in the configData variables of the Helm chart for the RCA Availability Engine microservice. You can use either the Microservices user interface or the command line to set the variables. See the default configurations RCA Availability Engine in Unified Assurance Implementation Guide for more information.
Installing and Configuring the RCA Availability Engine Microservice
For information about installing and configuring the RCA Availability Engine microservice, including prerequisites and default configuration parameters, see RCA Availability Engine in Unified Assurance Implementation Guide.
After installing the RCA Availability Engine microservice, you can manage it and view the Helm charts in the Microservices configuration interface.
Viewing Root Cause Information
You can view root cause information in Events lists.
The Event Type column shows the root cause event type. Event rows with a link icon have symptom events. Looking for this icon lets you quickly identify root events and focus your problem solving there.
Select an event to view root cause information in the following locations:
-
On the Info tab:
-
The RootCauseFlag field. For root events, the value is 1. For symptom or standalone events, the value is 0.
-
The RootCauseID field. For root or standalone events, the value is 0. For symptom events, the value indicates the root event's ID.
-
-
The Details tab shows you the event details in JSON format. This includes device information, the event type, event and error messages, the root cause type (standalone, root, or symptom), and, for symptoms, the root cause device and event information.
-
For root events, the Symptom Events tab contains a list of symptom events.
Root Cause Analysis Examples
The following examples use the deployment architecture shown below. This deployment uses two sets of routers, distribution switches, and access switches to achieve high availability.
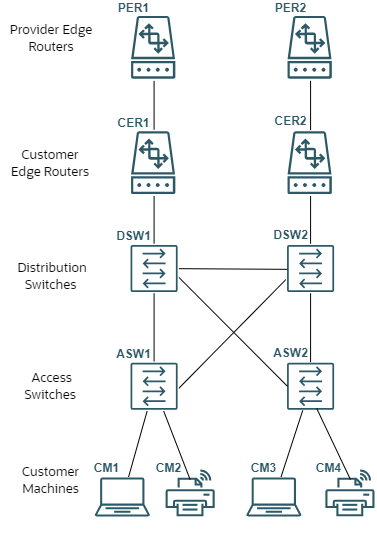
Description of RCA Example Deployment
Example: Provide Edge Router 1 is Down
When one of the provider edge routers goes down, the interface connection to the customer edge router and the BGP session between them also go down. The network switches over to use the other router so no other downstream devices go down.
When the RCA Availability Engine microservice picks up the outage events, it works up the network topology to identify any related outages. It identifies PER1 as the root outage and generates the following events:
-
A Device Down event for PER1, marked as the root cause event.
-
An Interface Down event for CER1's interface, marked as a symptom event.
-
A BGP Session Down event for the session between the routers, marked as a symptom event.
The RCA Availability Engine microservice publishes these events to the assure1/event/collection topic, where they are picked up and moved downstream to be eventually added to the Event database. An operator investigating the events can quickly identify PER1 as the cause, and get it running again to bring the system back to full functionality.
Example: Distribution Switches are Down
When both distribution switches go down, all devices downstream of them become unreachable, and the interface connections and BGP sessions between the distribution switches and the customer edge routers go down.
When the RCA Availability Engine microservice picks up the outage events, it works up the network topology to identify any related outages. Because both distribution switches are out, the root cause of the downstream outages could be either of them. RCA checks the RCA_priority set for each device and, because DSW1 has a higher priority, it is identified as the root outage.
RCA generates the following events:
-
A Device Down event for DSW1, marked as the root cause event.
-
Interface Down events for the interfaces between the distribution switches and the customer edge routers, marked as symptom events of the DSW1 event.
-
BGP Session Down events for the sessions between the distribution switches and the customer edge routers, marked as symptom events of the DSW1 event.
-
Device Unreachable events for DSW2, both access switches, and all customer machines, marked as symptom events of the DSW1 event.
The RCA Availability Engine microservice publishes these events to the assure1/event/collection topic, where they are picked up and moved downstream to be eventually added to the Event database. An operator investigating the events can quickly identify DSW1 as the cause, and get it running again.
If DSW2 is still down after resolving the problem with DSW1, the downstream elements will switch over to DSW1. New events will be generated for DSW2, its interface connections, and the session with CER2, which an operator can then investigate.
Example: Whole Network is Down
When the whole network is down and the RCA Availability Engine microservice picks up the outage events, it works up the network topology to identify any related outages. Discovering that everything is down, it checks the RCA_priority set for each root-level device (PER1 and PER2), and because PER1 has a higher priority, it is identified as the root outage.
RCA generates the following events:
-
An Isolated Segment event for PER1, because there are no other connected available devices. This is marked as the root cause event.
-
Interface Down events for all interfaces, marked as symptom events of the PER1 event.
-
BGP Session Down events for all sessions, marked as symptom events of the PER1 event.
-
Device Unreachable events for all devices, marked as symptom events of the PER1 event.
The RCA Availability Engine microservice publishes these events to the assure1/event/collection topic, where they are picked up and moved downstream to be eventually added to the Event database. An operator investigating the events can quickly identify PER1 as the cause, get it running again, and then identify and resolve any remaining outages after PER1 comes back online.
Related Topics
- Understanding Microservices
- Understanding Device Discovery
- RCA Availability Engine in Unified Assurance Implementation Guide
- SNMP Poller in Unified Assurance Implementation Guide
- Ping Poller in Unified Assurance Implementation Guide