About the Mediation Engine Connector Dashboard

After logging in, you should see the Mediation Engine Connector dashboard. In the top-right corner, a drop-down menu displays the current user and contains links to the Mediation Engines window, the HTML version of this manual (opens in a new browser window), and the option to logout.

Figure 1-1 Dashboard
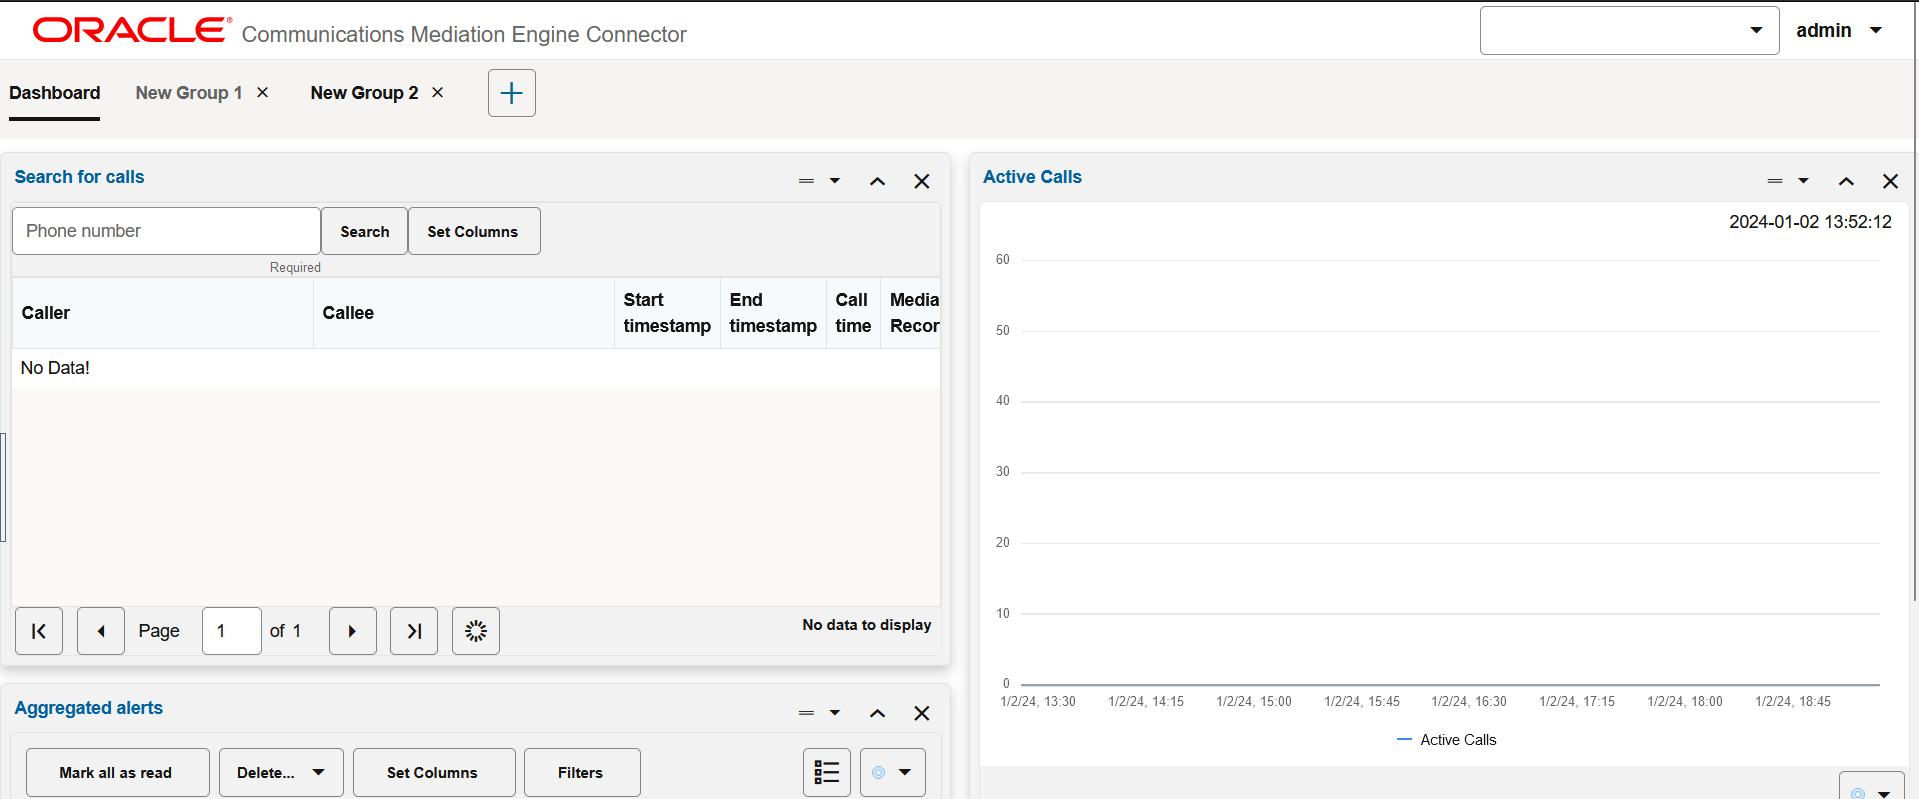
This is the Dashboard screen for the Mediation Engine Connector

The Mediation Engine Connector dashboard is similar to the dashboard of the mediation engines. It allows you to view at a glance important information retrieved from single probes, as well as information aggregated from all mediation engines. The dashboard contains a configurable number of panels, which can be added or removed by the user. The following functionality is available for the Mediation Engine Connector dashboard.

Adding a Dashboard Panel

You can add two types of Dashboard panels using the Dashboard screen.

You can choose to add either a Regional Dashboard Panel or a Node Panel. Scroll to the bottom of the page to add Dashboard panels.
  • Regional Dasboard Panel: The Mediation Engine Connector queries all the Mediation Engines to find the required information.
  • Node Panel: The Mediation Engine Connector queries the specific node that you select, as the source of information.

Adding a Regional Panel to the Dashboard

A Regional Panel allows you to view all generic Mediation Engine Connector specific information at a glance that is most important to you. These panels have combined information from all connected Mediation Engines.

To add a Regional Panel to the Dashboard:
  1. In the Dashboard screen of the Mediation Connector Engine, scroll to the bottom of the screen.
  2. Click the Add Regional Panel drop-down list.
    You can add any of the following Regional Panels:
    • Call Search
    • Advanced Search (Per Mediation Engine)
    • User Search
    • Saved Calls
    • Active Calls Chart
    • Aggregated Alerts
    • Simultaneously Active Users
    • Simultaneously Attached Users
    • Regional Map
  3. Provide a tile for the new Dashboard Panel.
  4. Click OK.
    A new Dashboard panel is added.

Adding a Node Panel to the Dashboard

A Node Panel allows you to view the individual Mediation Engine specific information at a glance that is most important to you. These panels have only the information from a specific connected Mediation Engine for which the panel is being created.

To add a Node Panel to the Dashboard:
  1. In the Dashboard screen of the Mediation Connector Engine, scroll to the bottom of the screen.
  2. Click the Add Node Panel.
  3. In the Add a Panel dialog box, select the node which should be the source of information from the Select a node drop-down list.
  4. Click Next.
  5. In the next step, select the type of Dashboard panel. You can add any oof the following Dashboard panels:
    • Display a metric/KPI
    • Display recent calls
    • Display registrations
    • Display subscriptions
    • Display alerts
    • Display voice quality data
    • Display user devices chart
    • Display calls by a particular user
    • Display calls passing a platform device
    • Display calls terminated by a platform device
    • Display calls created by a platform device
    • Display registrations of a particular user
    • Display registrations at a particular device
    • Display subscriptions of a particular user
    • Display subscriptions at a particular device
    • Display a device metric/KPI
    • Display Simultaneously Active Users
    • Display Simultaneously Attached Users
  6. In the next step, refine the data that must be displayed in the Dashboard Panel.
  7. Provide a tile for the new Dashboard Panel.
  8. Click Finish.
    A new Dashboard panel is added.

Filter for Panels in the Dashboard

You can filter for panels in the Dashboard such that Panels that contain the search term in their name, are displayed in the Dashboard.

To configure a filter for panels:
  1. In the Dashboard screen, scroll to the bottom of the screen.
  2. In the Filter for Panels text box, type in the search term. For example, Calls. All panels that have the term calls in the name, are displayed in the Dashboard.
    The filter for panel will be applicable only for the current login session. If you log out of the Mediation Engine Connector user interface, all the panels are displayed in the Dashboard.

Removing a Dashboard Panel

To remove a dashboard panel:
  1. Click the cross button in the upper-right corner of the panel.
    A dialog box appears.
  2. Click Yes.
The dashboard panel gets removed.

Cutting and Pasting Panels in the Dashboard

You can reorder the placement of panels in the Dashboard using the Cut and Paste options provided for a panel.

To cut and paste the panels in the Dashboard:
  1. In the panel that needs to reordered, for example, Active Calls, click the Cut and Paste options drop-down.
  2. Select Cut.
  3. Go to the panel over which the reordered panel needs to be placed. For example, if you want to place Active Calls over User Search, go to the User Search panel.
  4. Click Paste Above. This places the panel that was cut above the existing panel. For example if you click Paste Above in the User Search panel, the Active Calls panel is place above the User Search panel.

Adding a Group Tab

To add a group tab:
  1. Click + in the Dashboard.
  2. In the New Group dialog box, provide a name for the new goup. New Group 1 is the default name. You can create multiple dashboard panels.

Note:

When a new widget is added in the Dashboard tab which is not the default, the widget gets added in the default dashboard.

Rearranging Dashboard Panels

Dashboard panels can be rearranged using drag and drop. Drag a dashboard panel by clicking and holding the title bar and drop it where you would like it to stay on the page.

Enabling Dashboard Panel Refresh

The information in a dashboard panel refreshes only when it is active in a dashboard tab. Panels refresh only when they are visible to the user in an active browser window. You can change this behavior to enable panels to continue to refresh when they are not displayed in an active browser window.

Note:

Enabling panel refresh can affect the system performance.
To enable dashboard panels to refresh:
  1. Select the menu title that displays your user name.
  2. Click My Profile.
    The Edit own user information menu appears.
  3. From the Widgets Refresh list, select refresh options that you would like to enable.
  4. Click Finish.