Subscriptions
The Subscription page allows you to view and analyze non-call messages and notifications of presence events. Currently, only subscribe, notify, and publish messages are supported.
- Subscribed Users panel: Displays the number of subscribers and the fluctuation over time, and
- Subscriptions table: Displays subscriber event information. The Subscriptions table contains a table of subscription events. The list is ordered chronologically, presenting the latest event as the first entry by default.
System Settings for Subscription
These are the system settings for the Subscription feature:
Allow Number of Refresh subscription
Flag to limit the number of Refresh SUBSCRIBE entries to be seen in the ladder diagram. (Initial Subscription not included)
- Default value: 10
- Maximum value: 20
- Minimum value: 0. '0' means none of the Refresh Subscribe messages can be seen in the ladder diagram.
Allow regeneration of subscription events for user updates
If a user has Subscribed in the core once, it's realm is not re-checked till the Subscription expires and gets renewed. If realms are changed continuously and/or the customer needs to have subscriptions always matched to the current realms configuration, enable this option. Doing so, has some performance impacts on the core subscription processing.
Default value: False
Group Non-Call Subscriptions from the same user
This setting enables you to group Non-Call Subscriptions from the same user and event type. The default value is True.
Match Subscription events by comparing the username suffix
The Mediation Engine matches the related subscription attempts by the SIP username. If this value is zero, then the whole username is used. If more than zero, the number defines how many digits/characters must match.
- Default value: 0
- Maximum value: 50
- Minimum value: 0
Search for matching Non-Call subscription segments
When viewing the diagram of a Non-Call Subscription event, the Mediation Engine searches for other Non-Call subscription events that are related. This option controls the time span in which it searches, in seconds. If set to 0, the searching of related Non-Call subscription events is disabled. The default value is 10, the maximum value is 25, and the minimum value is 0.
Subscriptions expired events
If enabled, an Expired event is generated when a subscription binding expires.
Default value: True
Platform Setup Application Initial Log In
All Session Monitor application interfaces are accessed through encrypted HTTPS connections. At the initial login, your web browser may not recognize the server and displays the warning: This Connection is Untrusted. Click Confirm Security Exception to proceed.
For information about how to protect connections to the system and avoid the untrusted certificate warning in the future, see Oracle Communications Session Monitor Security Guide.
This section describes how to configure Session Monitor using the Platform Setup Application.
To configure Session Monitor:
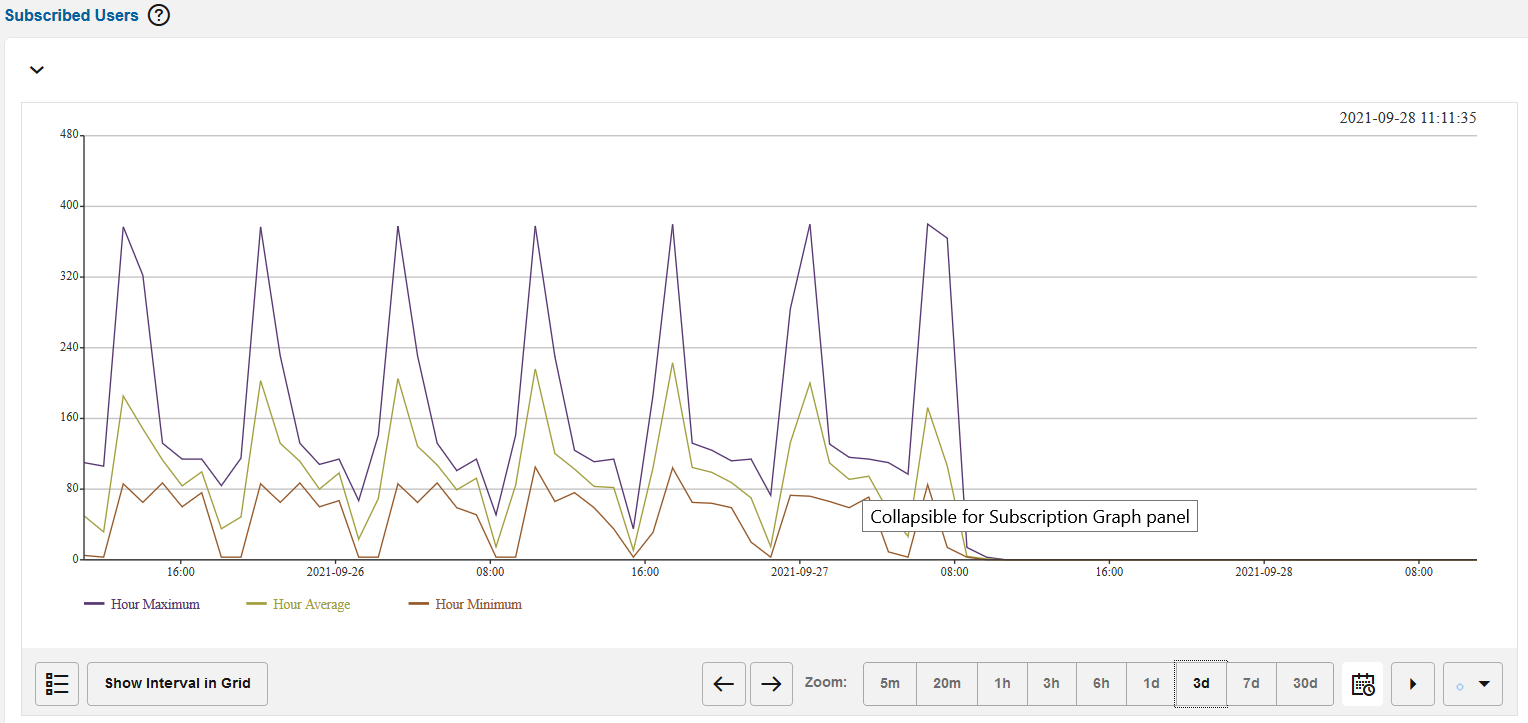
Subscribed Users Panel
The top panel contains a chart that traces the total number of subscribed users over time. The sampling interval is 1 minute for drawing the sample's minimum, maximum, and average values.
By default, a window of three hours is presented. The time frame can be adjusted and the chart allows for panning.
Figure 4-60 Subscribed Users Panel
Note:
If Operations Monitor has no subscription information over a period of time (due to factors like recent start up, downtime, or lack of traffic), that interval is indicated in the chart by a gray area.Subscriptions Table
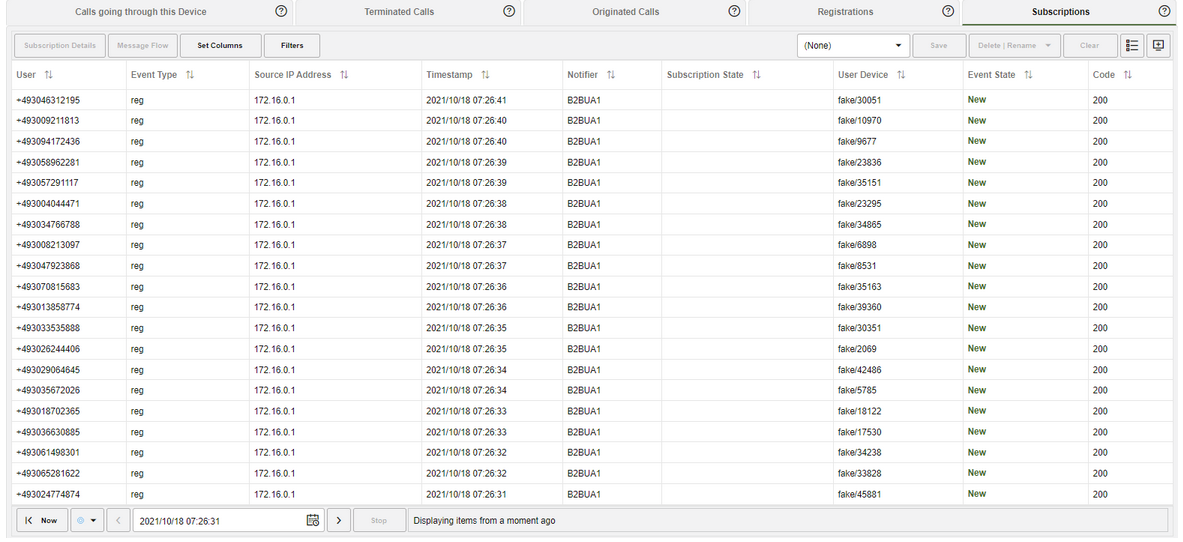
The Subscriptions panel contains a table of the subscription events. The list is ordered chronologically, presenting the latest event as the first entry by default. The table can be resorted and/or filtered. For more information, see "Filtering".
Note:
If the system setting Group New Subscriptions from the Same User is true, duplicate subscription events in state 'New' from the same users are grouped together. However, since the grouping is done on each requested chunk, duplication removal over different chunks does not work.This table lists the column descriptions for the Subscriptions table:
Table 4-15 Subscriptions Table
| Column | Description |
|---|---|
|
User |
Contains the user part of the AOR; if the system setting Use users domains is enabled, the domain part is also included in this field. When specifying a filtering token, all users that contain that token (position independent) will be shown. |
|
Event Type |
Event-type(SIP header Event of SUBSCRIBE) the User is Subscribing for. Filtering is done by matching a given string. |
|
Source IP address |
The IP address of the network device that initiated the subscription event. Filtering is done by matching a given string. |
|
Destination IP address |
The IP address of the network server targeted by the subscribing device. Filtering is done by matching a given string. |
|
Timestamp |
The moment in time when the event occurred. Filter by specifying an interval (between Before and After) or a Date (the On date selector). |
| Notifier | The device configured in Settings> Platform Devices that was targeted by the subscriber's device when subscribing. When trying to filter by a certain device, a list of configured devices is presented out of which one or more can be selected. |
| Method | Sip Message in this subscriptions. |
| Subscription State | State of this subscription as per the "Subscription-State" header in NOTIFY Message |
| User Device | The User-Agent header of the SUBSCRIBE request. |
| Subscribe Count | Indicates the total number of SUBSCRIBE messages received for this subscription including initial and refresh |
| Notify Count | Indicates the total number of NOTIFY messages received for this subscription |
| Publish Count | Indicates the total number of PUBLISH messages received for this subscription |
| Event State | The state of the Subscription Event. For filtering one can choose to filter the presented list to only include some of the possible event states. |
|
Code |
The SIP code that the subscription message exchange finished with. Filter by specifying any valid SIP reply code. |
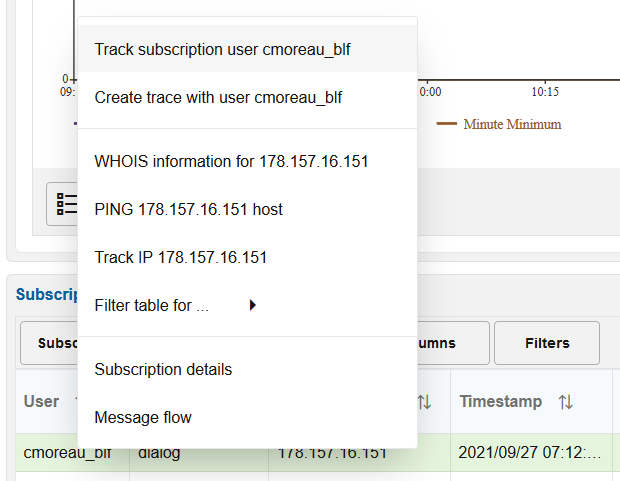
Right-Click Contextual Menu - Subscriptions
Right-click menu actions are as follows:
Table 4-16 Right-click menu options
| Menu option | Description |
|---|---|
| Track subscription user <user name> | Loads the User Tracking page with the User field pre-filled in the search panel taken from the event |
| Create Trace with user <user name> | Loads the Traces page with the User field pre-filled with the value taken from the corresponding subscription event. |
| WHOIS | Allows you to inquire who is the owner of the IP used as the source of the subscription. A window appears that contains the record stored into the WHOIS database for the given address |
| PING | Pings the source IP address. |
| Track IP | Redirects you to the IP tracking page to get the details about the specific IP. For more information, see IP Tracking |
| Filter Table for... | Filter table for ... allows you to filter for:
|
| Subscription Details | Opens the Subscription Details window |
| Message Flow | Opens the Message Flow window |
Figure 4-61 Subscriptions Table
Subscription Table Actions
The Subscription table provides a few action buttons.
-
Click the Subscription Details button when a row is selected in the table, and a window appears containing Subscription details for individual Subscription events; this window can be also opened by simply double-clicking on the selected row in the table.
-
Click the Message Flow button to open a SIP message flow diagram window that depicts the network entities involved and message exchange of the Subscription event.
-
Click the Set Columns button hide/unhide the columns from the display.
-
Click the Filters button to define filters and to see the required information in the table. The Filters selection list, Save, Delete|Rename, and Clear are all options related to Filters. For more information, see Filters section.
-
The CSV export button allows to have all table entries exported into a CSV file. If the contents of the table have been filtered, the contents of the exported CSV file will only contain the filtered results.
- The Show in Dashboard button allows you to add the panel, with the current filter settings applied, to the dashboard.
Note:
Many of these actions are available by right-clicking on a row.
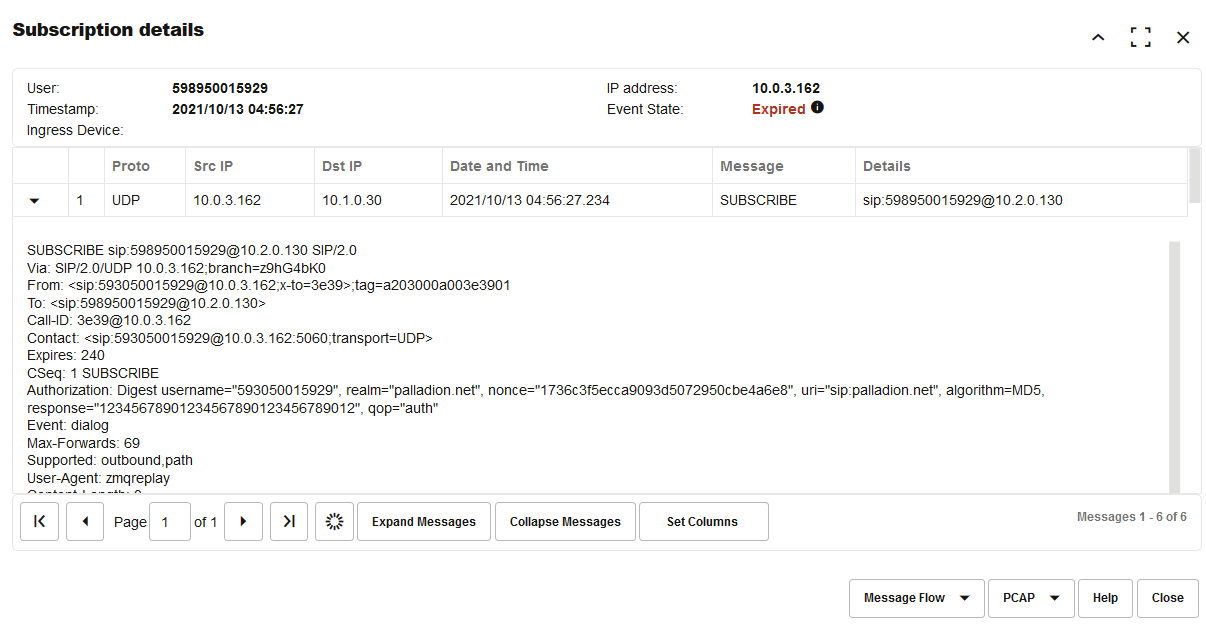
Subscription Details
The details window for a Subscription event contains the following information:
-
The user of full AOR (subjected to settings).
-
The timestamp when the event occurred.
-
The network entity of the platform having received the subscription request (the ingress device).
-
The IP address used to originate the requests.
-
The type of subscription event.
-
A table that contains details about the exchanged messages in this event, listed in chronological order.
This table lists the columns in Subscriptions Details window.
Table 4-17 Subscription Details Window
| Column | Description |
|---|---|
| User | The user of full AOR |
|
Proto |
The network transport protocol used to carry the SIP messages from client to the platform. This field can be either UDP or TCP. |
|
Src IP |
The IP address of the device that generated the message. |
| Dst IP | The IP address of the device that received the message. |
| Date and Time | The moment in time when the mirrored network packet was received by Operations Monitor. |
|
Details |
The device that received the message; just as with Source, it can be either the client's or platform's. |
|
Message |
SIP message which caused the particular event. |
Subscription Details Actions
- Click Expand Messages to view all the raw SIP message as seen on the network. You can click Collapse Messages again to display the brief view of the messages.
- Click Set columns to Hide or Unhide columns from display.
Note:
You can view one raw message at a time by clicking the Triangle button on any of the table's entries, as shown.Figure 4-62 Subscription Details Window with One Expanded Raw Message
- Message Flow
Creates a message flow diagram
- Open in new window
Opens the message flow diagram in a new window.
- SVG
Opens the message flow diagram in a SVG window from which you can save the message flow as a .png graphic.
The PCAP option allows you to save the shown network packets into a PCAP file.
Subscription Event Categories
Subscription events are categorized as follows:
-
Failed
Final response code is greater than 299.
-
Unauthorized
Two consecutive transactions are answered with 401, or when one 401 transaction is not followed by another SUBSCRIBE request in the next 5 seconds.
-
New
A new Subscribe binding was created for this user.
- Refresh
Subscription event of type 'Refresh' is created for a successful SUBSCRIBE or NOTIFY transaction with 200 response when the Subscription of the user is refreshed.
-
Gone
Subscription event of type 'Gone' is created when there is Un-subscribe (expire value is '0' in SUBSCRIBE/NOTIFY transaction) for the Subscribed user.
-
Expired
A binding is considered expired when the time interval specified in the 'expires' parameter from the Notifier's answer is over. No messages are associated with this type of event. For each Subscribed user, timer_expired is initialized with expires value agreed for the subscription. When the subscription of the user is not refreshed and if the subscription duration exceeds the 'expires' value.
Subscriptions Panel in User Tracking
The Subscriptions Panel contains two tables where the first displays the current subscriptions and the second panel displays history of the subscription events for the tracked user.
Figure 4-63 Subscriptions Panel in User Tracking
Table 4-18 Current Subscribed Contacts Table
| Column Name | Description |
|---|---|
| Event | Event the User is Subscribing for. Filtering is done by matching a given string |
| IP address | The IP address from where the Subscribe request originates. |
| Expires | The expiration interval set by the server. |
| Expires In | The remaining time until expiration. |
| Refreshed | The last time the registrations was refreshed. |
| First Seen | The first time the tracked user subscribed successfully. |
| Link | An indicator for the link quality to the tracked user which is displays in the Link Quality section. This column remains blank unless the particular users subscribed source IP address is set to be tracked for the Link Quality. The indicator is of LED diode icon with coloring based on the quality measured. |
| User Device | The User-Agent header of the SUBSCRIBE request. |
| Suggested Expires | It contains the value of the Expires header sent with the SUBSCRIBE request. |
| VLAN | VLAN of the device. |
The lower table contains the history of subscription events for the tracked user.
Subscribed Users Panel in IP Tracking
The Subscribed Users panel displays the users that are currently subscribed with the searched IP address(es). The results include the user, the IP address, and the subscribed event of the user.
You can jump to the Subscribed Event page using the right-click menu.
Figure 4-64 Subscribed Users Panel
Operations on User Devices
You can filter and group user devices with the following actions in the User Devices chart:
-
Select data source
You can select whether the statistics displayed on the User Devices page is based on registrations, callers, callees, or subscriptions. To choose a display, select one of these from the drop-down menu to the left below the chart:- View Registration
- View Callers
- View Callee
- View Subscriptions
-
Restrict the User Devices page
You can specify the statistics on the User Devices page to match or not match a certain regular expression. Enter a regular expression into the text field to the left of the filter button below the chart. Click Filter. If you want to invert the match, mark the Invert check box below the chart.
-
Group devices
To create a new group of user devices, enter a regular expression in the Filter for device field and click the Create group button. The new group rule is applied to the Device List panel (below the chart). If the Show grouping check box below the chart is marked, the groupings are also applied to the pie chart.
Figure 4-65 Operations on User Devices

Note:
When you create filter or group user devices, this is applied to the User Devices chart and the Devices list.The User Devices chart also contains the Show in Dashboard icon button in the bottom-right corner. Click this button to add the panel, with the current filter settings applied, to the dashboard.
Subscriptions Tab in Devices Page
The Subscriptions tab aggregates information about each device where the Subscribe message originated from.
Figure 4-66 Subscriptions Tab
Alert Definitions Tab
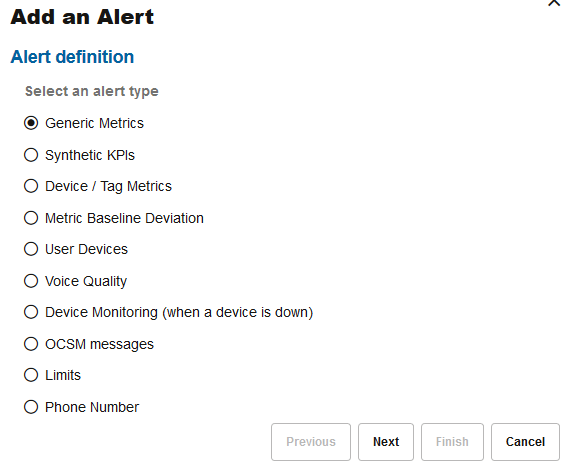
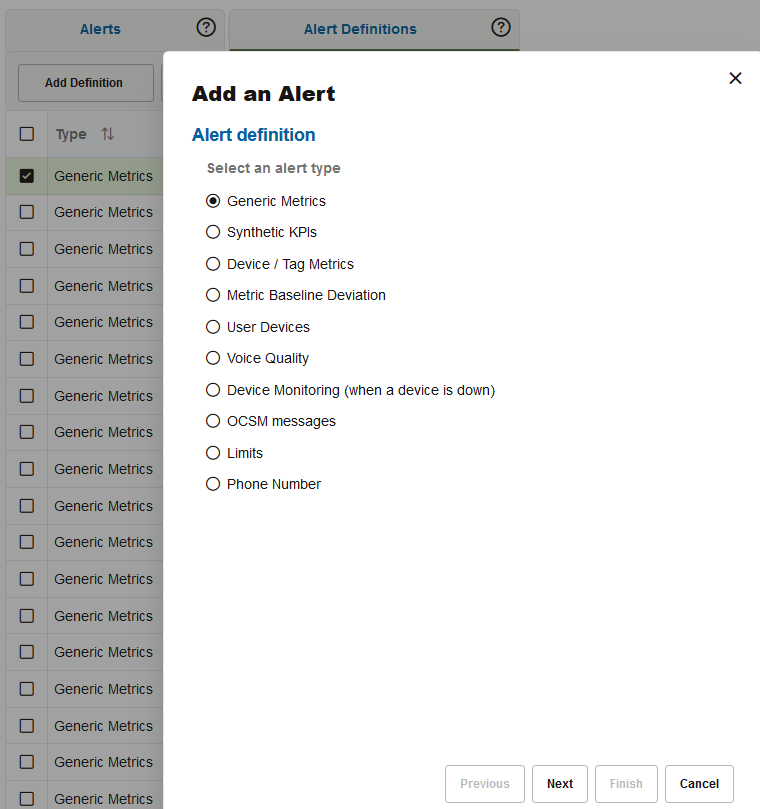
Alert definitions establish which events on the system raise a notification. On the Alerts page, click the Alert Definitions tab to add a new alert definition. You can also add Alert definitions for the KPIs provided for Non-Call messages such as SUBSCRIBE, NOTIFY, and PUBLISH.
Figure 4-67 Add an Alert Definition
Actions
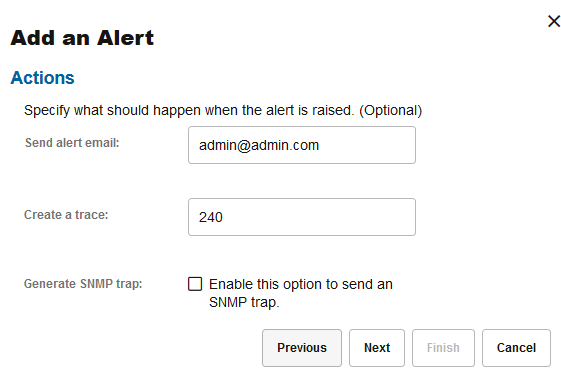
Figure 4-69 Actions
-
Send alert e-mail
Sends an e-mail about the alert to the specified address. An SMTP access needs to be configured before. For more information about configuring SMTP, see Configuring SMTP Settings.
For most alert types, a deep link to the source of the alert can be provided in the alert e-mail. To receive this link, you must first configure the External IP/hostname. For more information, see External IP/hostname.
-
Create a trace
Creates a trace of the current SIP traffic when the alert is raised. Enter an appropriate time span (in seconds) for packet capture to tell Operations Monitor how far back in time the trace should go.
- Generate SNMP trap
Sends an SNMP trap to a configured SNMP target. When this is enabled, Operations Monitor alerts can be tracked and analyzed by an SNMP manager in the network. For more information, see "SNMP Options".
Alert Name and Priority
Note:
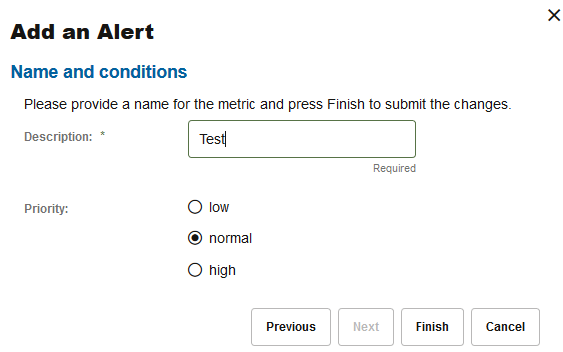
The Minimum active calls condition is checked at the time of the alert generation, which is (depending on server load) one to several minutes later than the actual alert condition.Figure 4-70 Alert Name and Priority
Editing and Deleting Alert Definitions
To edit a definition, perform one of the following actions:
- Select the entry and click Delete.
- Double click the entry.
To delete a definition, select the entry and click Delete definition. Once an alert has been deleted, Operations Monitor no longer raises a notification for this definition.
