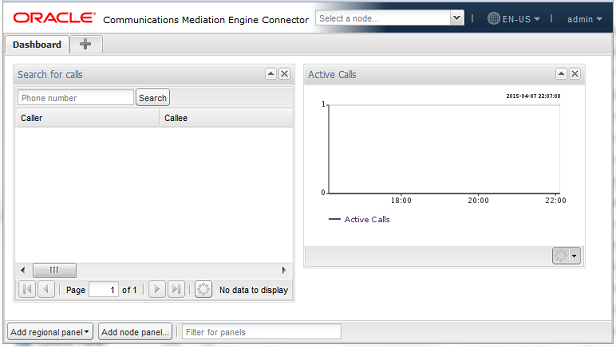
About the Mediation Engine Connector Dashboard
After logging in, you should see the Mediation Engine Connector dashboard. In the top-right corner, a drop-down menu displays the current user and contains links to the Mediation Engines window, the HTML version of this manual (opens in a new browser window), and the option to logout.

The Mediation Engine Connector dashboard is similar to the dashboard of the mediation engines. It allows you to view at a glance important information retrieved from single probes, as well as information aggregated from all mediation engines. The dashboard contains a configurable number of panels, which can be added or removed by the user. The following functionality is available for the Mediation Engine Connector dashboard.
Adding a Group Tab
Note:
When a new widget is added in the Dashboard tab which is not the default, the widget gets added in the default dashboard.Rearranging Dashboard Panels
Enabling Dashboard Panel Refresh
Note:
Enabling panel refresh can affect the system performance.