View Summary Data

The following summary data can include general SDM system-level information (for example,c the local date and time (with time zone adjustment) of the SDM server), key performance indicator (KPI) data, or data retrieved for NF devices managed by Oracle Communications Session Element Manager. When you expand the Dashboard Manager slider and select Summary view, the Summary pane displays summary information for all active and standby devices similar to what is shown in the following figure:

Figure 10-1 Dashboard Manager Summary View
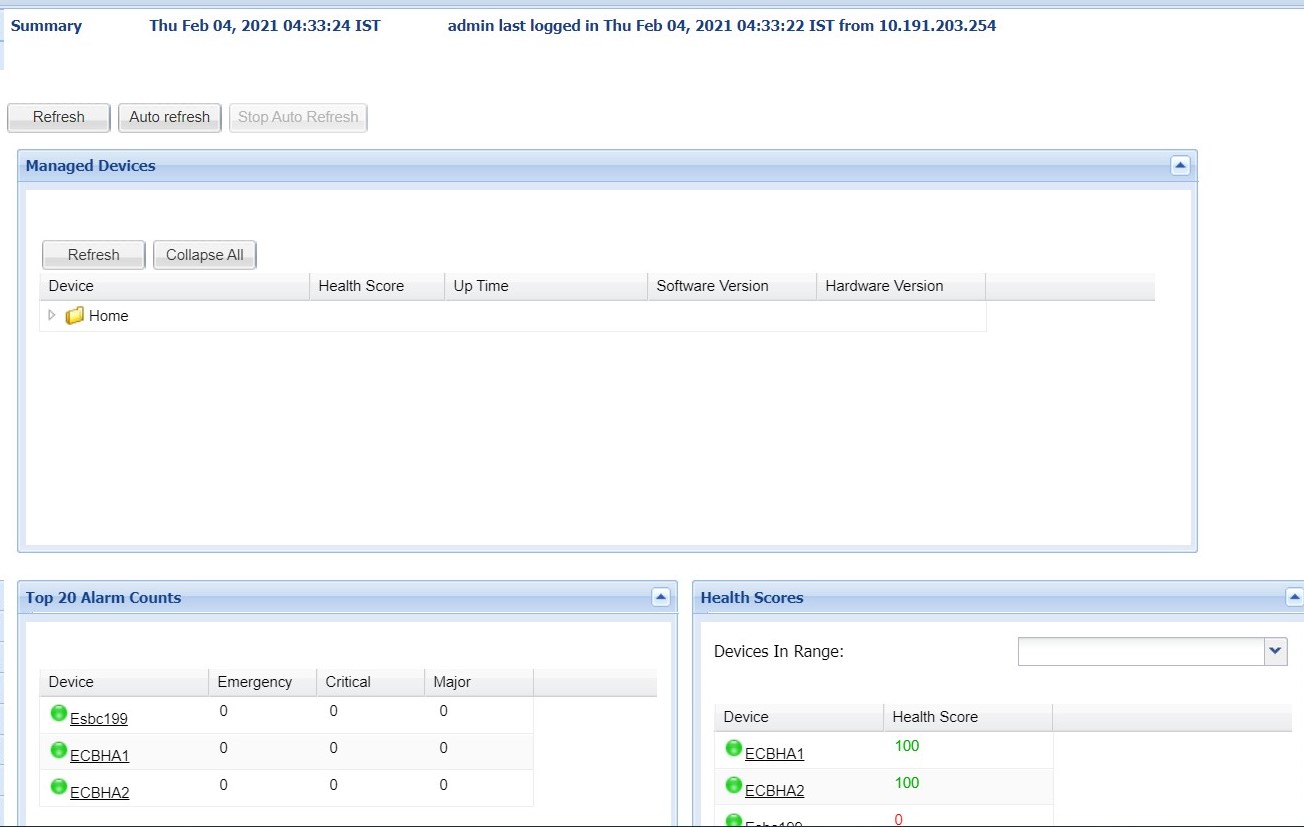

Dashboard Manager Summary

The following portals are displayed:

  • Managed Devices—A list of all managed devices by either IP address or host name.
  • Top 20 Alarm Counts—Key performance indicators (KPI) for the alarm (fault) status summary for each device.
  • Health Scores— Tabular data that represents the health score of devices. The health scores can be interpretted as:
    • 75-100 - Average to good health
    • 50 to 74 - Poor to average health
    • below 50 - Poor health.
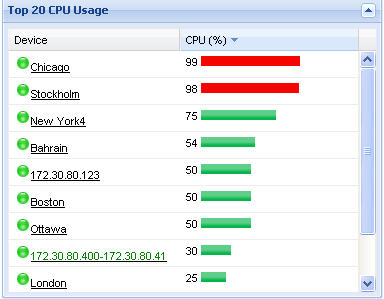
  • Top 20 CPU Usage—A list of the top 20 devices that display based on their CPU usage.
  • Top 20 Memory Usage—A list of the top 20 devices that display based on their memory usage.
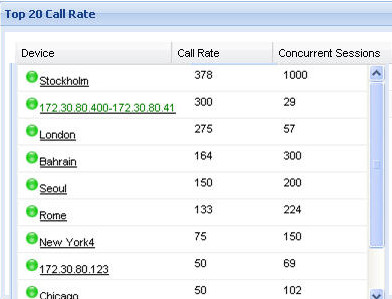
  • Top 20 Call Rate—A list of the top 20 devices that display based on the number of calls and concurrent sessions on each device.
  • Logged In Users—A list of users logged into SDM with session start times and locations (IP addresses).

Refresh Data

  1. Expand the Dashboard Manager slider and select Summary view.
  2. At the top of the Summary pane, click Refresh to update the whole dashboard summary view.

Configure Auto Refresh

  1. Expand the Dashboard Manager slider and select Summary view.
  2. Click Auto refresh.
  3. In the Auto refresh dialog box, enter the number of seconds for when the page contents update.
  4. Click OK.

Stop Auto Refresh

  1. Expand the Dashboard Manager slider and select Summary view.
  2. Click Stop Auto Refresh to cancel a configured auto refresh interval for when the page contents update.

    Note:

    This button appears when the auto refresh function is configured only.

View Managed Device Data

  1. Expand the Dashboard Manager slider and select Summary view.
  2. In the Managed Devices table, expand a device group folder(s) to navigate to the device you want to view.

View Key Performance Indicator Data

  1. Expand the Dashboard Manager slider and select Summary view.
  2. In the Device column of the Managed Devices table, select the device you want to view. In the Key Performance Indicators table, the following information displays for your device:
  3. Click Refresh to update KPI data.
  4. Click View Alarms to view alarm data in Fault Manager.
  5. Click Back to return to the main summary view display.

View Alarm Summary Data

  1. Expand the Dashboard Manager slider and select Summary view.
  2. In the Device column of the Managed Devices table, select the device you want to view. In the Alarm Summary area, you can see tabular data that displays the alarms summary data.
  3. Click Refresh to update alarm summary data.
  4. Click View Alarms to view alarm data in Fault Manager.
  5. Click Back to return to the main summary view display.

View License Information

  1. Expand the Dashboard Manager slider and select Summary view.
  2. In the Device column of the Managed Devices table, select the device you want to view. In the License Information table, the following information displays for your device:
  3. Click Refresh to update license data.
  4. Click View Alarms to view alarm data in Fault Manager.
  5. Click Back to return to the main summary view display.

View Health Score Data

  1. Expand the Dashboard Manager slider and select Summary view.
  2. In the Health Scores dialog box, you can view the health score percentage ranges for your devices or see individual devices in the Device list to display additional data for each device.
  3. In the Health Scores dialog box, use the Devices in Range drop-down list to select the range of devices for which you want to view health scores:
    • View All
    • 75-100—Average to good health.
    • 50-74—Poor to average health.
    • 0-49—Poor health.

View Top 20 Memory Usage

  1. Expand the Dashboard Manager slider and select Summary view.
  2. In the Top 20 Memory Usage dialog box, a summary of the top 20 devices currently using the most memory the table is sorted by the descending percentage of memory. Mouse over each device to see additional information.

    The Memory Usage column displays the percentage of the memory utilization, followed by a colored bar, which corresponds with the memory usage percentage. The greater the percentage, the longer the bar. A red bar indicates a warning that memory usage is between 90% and 100% and a green bar indicates memory usage is below 90%.

View Top 20 CPU Usage

  1. Expand the Dashboard Manager slider and select Summary view.
  2. In the Top 20 CPU Usage dialog box, a summary of the top 20 devices with the most current percentage of CPU utilization is sorted by the descending percentage of CPU utilization. Mouse over each device to see additional information.

    The CPU (%) column displays the percentage of the CPU utilization, followed by a colored bar, which corresponds with the CPU usage percentage. The greater the percentage, the longer the bar. A red bar indicates a warning that CPU usage is between 90% and 100% and a green bar indicates memory usage is below 90%.

    Refer to the previous paragraph for a description of this illustration.

View Top 20 Alarm Counts

  1. Expand the Dashboard Manager slider and select Summary view.
  2. In the Top 20 Alarm Counts dialog box, a summary of the top 20 devices with generated alarms that include EMERGENCY, CRITICAL and MAJOR designations. You can position your mouse over each device to see additional information for the device.
View Top 20 Call Rate

  1. Expand the Dashboard Manager slider and select Summary view.
  2. Expand the Dashboard Manager slider and click Summary View.
  3. In the Top 20 Call Rate dialog box, a summary of the top 20 devices with highest number of active calls and concurrent sessions for each device. Mouse over each device to see additional information. For example:
    Refer to the previous paragraph for a descriptin of this illustration.

View Logged In Users

  1. Expand the Dashboard Manager slider and select Summary view.
  2. In the Logged In Users dialog box, a summary of users logged into Oracle Communications Session Delivery Manager with the appropriate privileges is sorted in ascending alphanumeric order by default with the IP address of the user system.

    Note:

    The list does not display if you do not have administration-level privileges.