View Summary Data
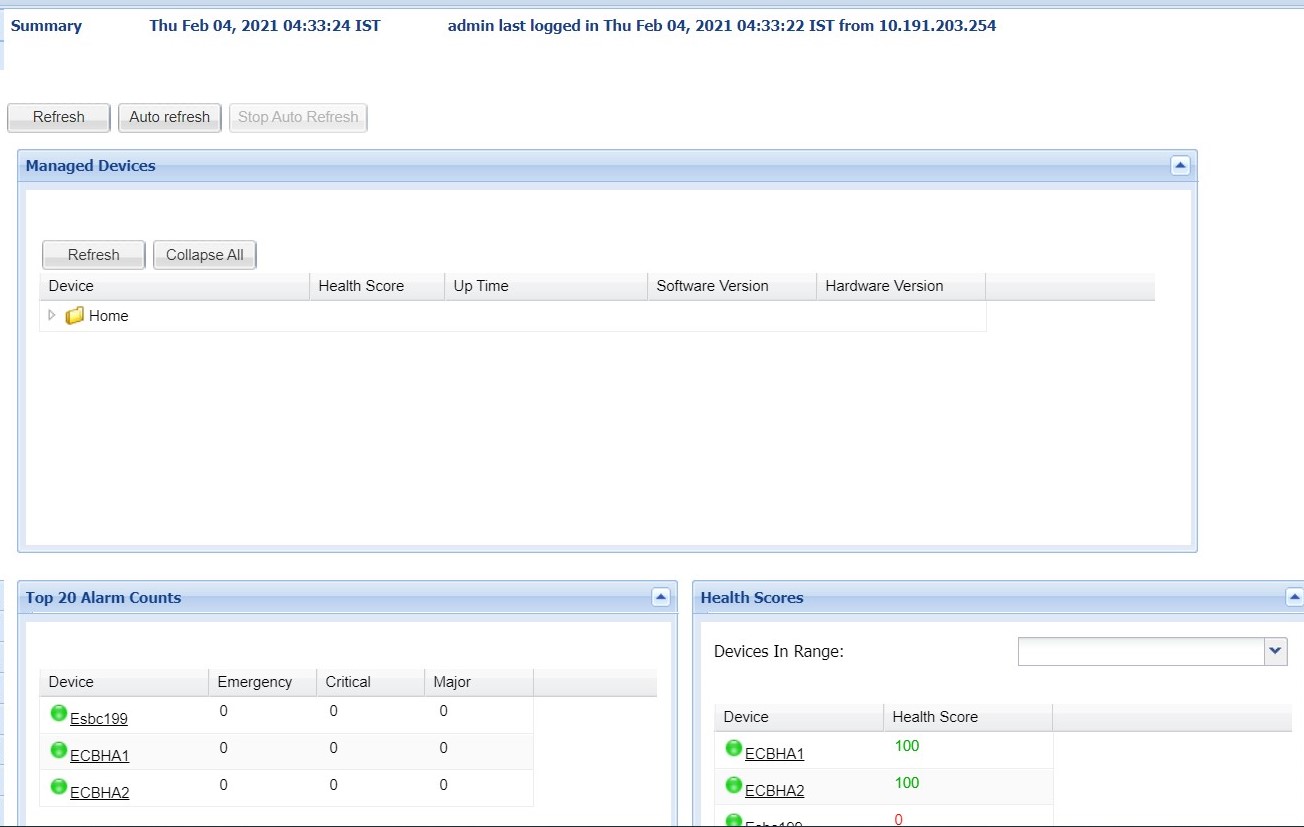
The following summary data can include general SDM system-level information (for example,c the local date and time (with time zone adjustment) of the SDM server), key performance indicator (KPI) data, or data retrieved for NF devices managed by Oracle Communications Session Element Manager. When you expand the Dashboard Manager slider and select Summary view, the Summary pane displays summary information for all active and standby devices similar to what is shown in the following figure:
Figure 10-1 Dashboard Manager Summary View

The following portals are displayed:
- Managed Devices—A list of all managed devices by either IP address or host name.
- Top 20 Alarm Counts—Key performance indicators (KPI) for the alarm (fault) status summary for each device.
- Health Scores—
Tabular data that represents the health score of devices. The health scores can be
interpretted as:
- 75-100 - Average to good health
- 50 to 74 - Poor to average health
- below 50 - Poor health.
- Top 20 CPU Usage—A list of the top 20 devices that display based on their CPU usage.
- Top 20 Memory Usage—A list of the top 20 devices that display based on their memory usage.
- Top 20 Call Rate—A list of the top 20 devices that display based on the number of calls and concurrent sessions on each device.
- Logged In Users—A list of users logged into SDM with session start times and locations (IP addresses).