4 Packet Trace
The Oracle Communications Session Border Controller (SBC) packet trace tool provides the ability to capture traffic from the SBC.
Caution:
packet-trace is a troubleshooting tool for use only with Oracle Support guidance. Oracle recommends using packet-trace only in lab environments and not under heavy load.Invoke the packet trace manually from the ACLI by specifying the following.
- Capture method (local vs remote)
- What to capture
- Capture start and stop
There are two capture modes, one that saves traffic locally and one that mirrors traffic to a user-specified target.
- Local capture supports PCAP filters to specify the type of traffic to capture. Remote capture supports its own syntax to identify the traffic to mirror.
- Local packet capture is dependent on access control configuration, not capturing any denied traffic. Remote capture mirrors traffic regardless of access control configuration.
- The system does not capture RTP through local packet capture.
- The system does not support running packet trace on a standby node.
Do not run packet-trace simultaneously with other SBC replication features, such as SRS, SIP Monitoring and Trace, and Call Recording. These features may interfere with each other, corrupting each ones results.
The default packet trace filter uses the specified interface to capture both
ingress and egress traffic. To specify captured traffic, you can append the command with
a PCAP filter enclosed in quotes. PCAP filter syntax is widely published (See Oracle
Linux man pages). You can determine the version of libpcap with the show
platform components command.
Refer to Wireshark, tcpdump and Berkley Packet Filter (BPF) syntax and example resources as guidance for your capture filters:
https://wiki.wireshark.org/CaptureFilters
https://www.tcpdump.org/manpages/pcap-filter.7.html
http://biot.com/capstats/bpf.html
Note:
When operating on a VNF, The SBC requires that you prepend the VLAN key to a capture filter to run packet-trace on VLAN interface. These commands take the following form.ORACLE# packet-trace local start <network interface> < vlan [vlan_id]&& capture filter>
Examples include:
ORACLE# packet-trace local start M00:100 "vlan && port 5060"or
ORACLE# packet-trace local start M00:100 "vlan 100 && port 5060"Packet Trace Remote
Packet trace remote enables the Oracle Communications Session Border Controller (SBC) to mirror traffic between two endpoints, or between itself and a specific endpoint to a user-specified target. To accomplish this, the SBC replicates the packets sent and received, encapsulates them according to RFC 2003, and sends them to a user-configured target. At the target, you capture and analyze the packets. The syntax for remote packet-trace is the same across platforms.
You can use the SBC remote capture feature to analyze:
- SIP signaling traffic—Subsequent media is also captured
- H323 signaling traffic—Subsequent media is also captured
- MSRP traffic—This includes the TCP handshake to set up connections and support MSRP traffic.
- IPv4 and IPv6 traffic
- Remote packet trace is capable of capturing IPv4 traffic when configured with an IPv6 address and vice-versa.
Currently, the SBC supports:
- One configurable trace server (on which you capture and analyze the traffic)
- Fifteen concurrent endpoint traces
To use this feature, the user configures a capture-receiver on the SBC so that it knows where to send the mirrored packets. Once the capture-receiver is configured, the user issues the packet-trace command to start, stop and specify filters for traces.
You establish a packet trace filter with the following information:
- Network interface—The name of the network interface on the SBC from which you want to trace packets. The user can enter this value as a name or as a name and subport identifier value (name:subportid)
- IP address—IP address of the endpoint to or from which the target traffic goes.
- Local port number—Optional parameter; Layer 4 port number on which the SBC receives and from which it sends; if no port is specified or if it is set to 0, then all ports will be traced
- Remote port number—Optional parameter; Layer 4 port number to which the SBC sends and from which it receives; if no port is specified or if it is set to 0, then all ports will be traced.
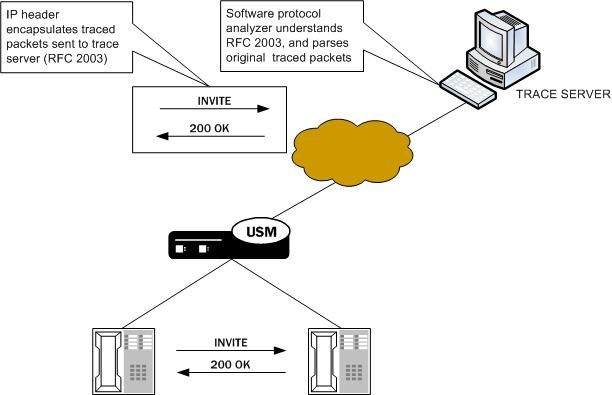
The SBC then encapsulates the original packets in accordance with RFC 2003 (IP Encapsulation within IP); it adds the requisite headers, and the payload contains the original packet trace with the Layer 2 header removed. Since software protocol analyzers understand RFC 2003, they can easily parse the original traced packets.

For large frames that are close to Maximum Transmission Unit (MTU) size, it is possible that when the SBC performs the steps to comply with RFC 2003 by adding the requisite header that the resulting packet might exceed Ethernet MTU size. If required, the SBC will create multiple fragments as needed before sending the packet output. If the SBC either receives or transmits IP fragments during a packet trace, the SBC performs reassembly and then performs the steps to comply with RFC 2003 by adding the requisite header, and then creates multiple fragments as needed before sending the packet output.
- Packet capture mode begins only after all fragments are received and assembled.
- When the complete packet is available the system adds the Outer IP header and applies more IP fragment logic with the payload as a complete packet including the Inner header.
- The first packet contains the Inner and Outer header. Subsequent packets contain only the Outer IP header.
The SBC continues to conduct the packet trace and send the replicated information to the trace server until you instruct it to stop. You stop a packet trace with the ACLI packet-trace remote stop command. With this command, you can stop either an individual packet trace or all packet traces that the SBC is conducting.
Packet Trace Local
Packet Trace Local enables the Oracle Communications Session Border Controller to capture traffic between two endpoints, or between itself and a specific endpoint. To accomplish this, the Oracle Communications Session Border Controller replicates the packets sent and received and saves them to disk in PCAP format.
The default packet trace filter uses the specified interface to capture both ingress and egress traffic. The command syntax differs based on platform. To specify captured traffic, you can append the command with a PCAP filter enclosed in quotes. PCAP filter syntax is widely published.
While capturing, the system displays the number of packets captured and prevents you from entering any other ACLI commands from that session. On Virtual Network Function (VNF) and virtual SBC systems, you stop captures using the command line syntax with the stop argument. On all other platforms, you terminate the capture by pressing Ctrl+C.
By default, the system saves the PCAP file in /opt/traces, naming it with the applicable interface name as well as the date and time of the capture. Alternatively, you can specify file name using the system supports the PCAP filter flags -w.
The system rotates the PCAP files created in this directory by size. The last 25 files are kept and are rotated when they reach 100 MB. If there are capture files in the /opt/traces directory when this command is run, the system prompts you to remove them before running new captures. If preferred, you can decline this file deletion.
Local packet capture is dependent on access control configuration, not capturing any denied traffic.
Note:
Although local packet trace captures and re-assembles fragmented packets, it does not recognize and show fragmentation of the capture.Packet Trace Scenarios
This section describes three possible ways that you might use the packet trace feature. You can examine communications sent to and from one endpoint, sent between two endpoints, or sent between ingress and/or egress Oracle Communications Session Border Controller interfaces to endpoints.
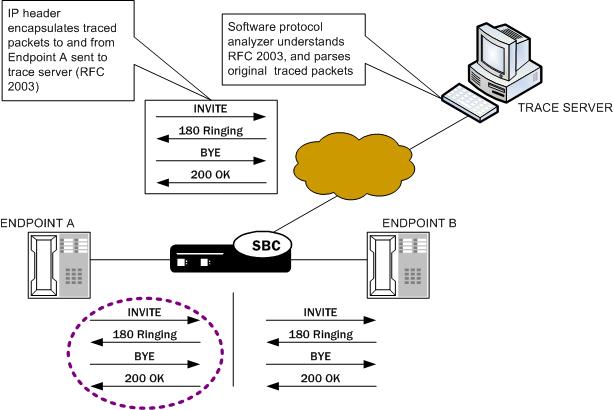
Packet Trace for One Endpoint
When you use the packet-trace remote start command, the Oracle Communications Session Border Controller sets up packet tracing for one endpoint. The SBC collects and replicates the packets to and from one endpoint. To enable this kind of trace, you set up one packet trace using the packet-trace command.
The commands you carry out for packet-trace remote would take the following form:
ORACLE# packet-trace remote start <interface> <IP address>
The syntax for packet-trace local commands on platforms that use the DPDK datapath take the following form:
packet-trace local start <interface> "<filter>"The syntax for packet-trace local commands on all other platforms take the following form:
packet-trace local <interface> "<filter>"For example, to start capturing traffic for a specific IP address on a DPDK datapath platform:
packet-trace local start s0p0 "host 10.2.2.20"Or to start capturing traffic for a specific IP address when you have configured VLANs on a DPDK datapath platform:
packet-trace local start M10:2990 "vlan and host 10.2.2.20"Or to start capturing traffic for a specific IP address when you have configured VLANs on a platform that does not support DPDK datapath:
packet-trace local F01:0 "vlan and host 10.2.2.20"Packet Trace for Both Call Legs
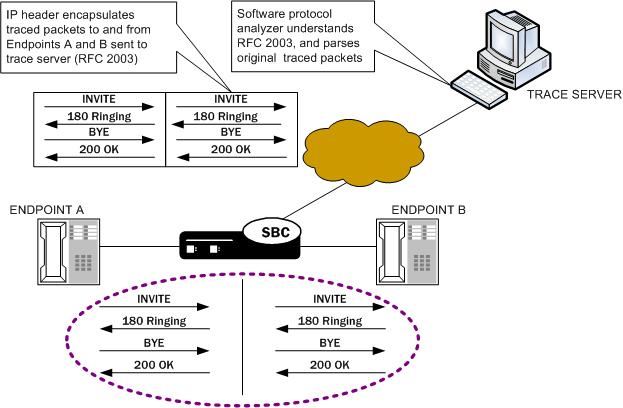
If you want to trace both sides (both call legs), then you must set up individual traces for each endpoint—meaning that you would initiate two packet traces. The results of the trace will give you the communications both call legs for the communication exchanged between the endpoints you specify.
If you initiate a packet trace for both endpoints that captures both signaling and media, the signaling will be captured as usual. However, RTP will only be traced for the ingress call leg. This is because the Oracle Communications Session Border Controller performs NAT on the RTP, which means it cannot be captured on the egress call leg.
The commands you carry out for packet-trace remote would take the following form:
ORACLE# packet-trace remote start F01:0 <IP address of Endpoint A>
ORACLE# packet-trace remote start F02:0 <IP address of Endpoint B>
The commands you carry out for packet-trace local would take the following form:
ORACLE# packet-trace local F01:0 "host <IP address of Endpoint A>"
ORACLE# packet-trace local F02:0 "host <IP address of Endpoint B>"
Packet Trace for a Signaling Address
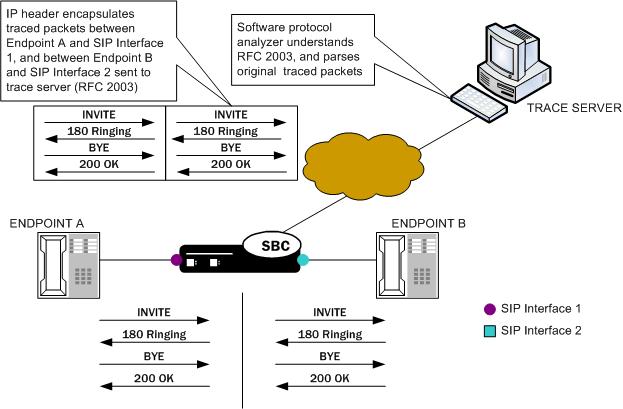
You can perform a packet trace for addresses internal to the SBC; this can be the address, for example, of a SIP interface. Using signaling interface addresses puts the emphasis on the SBC rather than on the endpoints by allowing you to view traffic from specified interfaces.
The commands you carry out for packet-trace remote would take the following form:
ORACLE# packet-trace remote start F01:0 <IP address of SBC interface1>
ORACLE# packet-trace remote start F02:0 <IP address of SBC interface2>
The commands you carry out for packet-trace local on platforms that use the DPDK datapath take the following form:
ORACLE# packet-trace local start F01:0 <"host IP address of SBC interface1">
ORACLE# packet-trace local start F02:0 <"host IP address of SBC interface2">
The commands you carry out for packet-trace local on all other platforms take the following form:
ORACLE# packet-trace local F01:0 <"host IP address of SBC interface1">
ORACLE# packet-trace local F02:0 <"host IP address of SBC interface2">
Note:
The system does not support egress RTP capture with Transcoding modules.