IPSec Tunnel Monitoring
Oracle SD-WAN Edge 5.0 expanded on the IPsec Tunnel functionality
introduced in Edge 4.4 by allowing third-party devices to terminate IPsec VPN
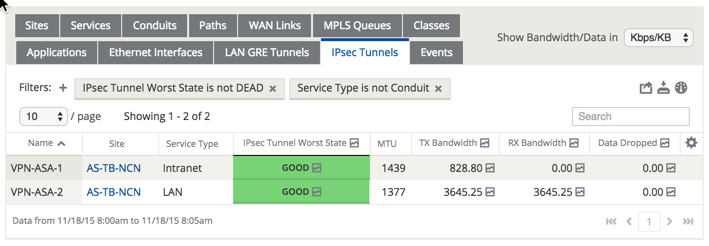
Tunnels on the LAN or WAN side of Appliances. You can monitor those IPsec
Tunnels using Aware 2.0 from the
IPsec
Tunnels tab of the
Monitor, and then
Reports screen. To
refine the displayed report results, click on the Show/Hide Columns icon (![]() ) and click the checkbox next to the
attributes you prefer to display in the report.
) and click the checkbox next to the
attributes you prefer to display in the report.
The following data is displayed for each LAN GRE Tunnel:
|
|

Figure 5: IPsec Tunnel Report
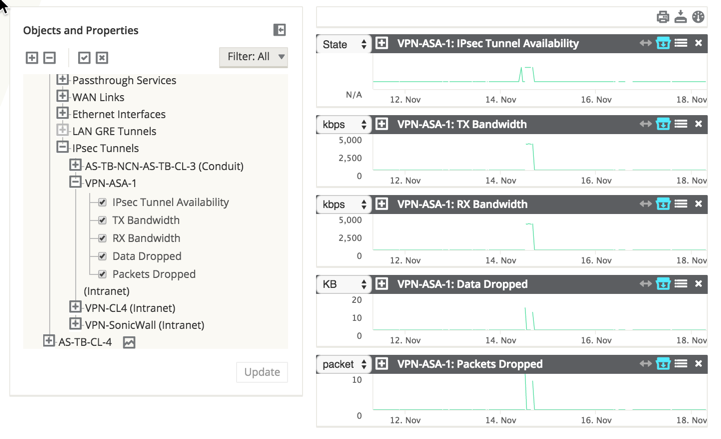
To generate IPsec Tunnel graphs, go to Monitor, and then Graphs and under [Site Name], and then IPsec Tunnels, and then [IPsec Tunnel Name] you can select from the following attributes:
|
|

Figure 6: IPsec Tunnel Graphs