Widgets Page
The Widgets Tab provides a place where you can select and view graphical
displays of data and statistics about the Oracle Enterprise Communications Broker (OECB) in the form of a widget. Most
widgets correspond to an equivalent ACLI show command. A
widget can display a list, a table, a graph, or text depending on the type of data and the
purpose of the display.
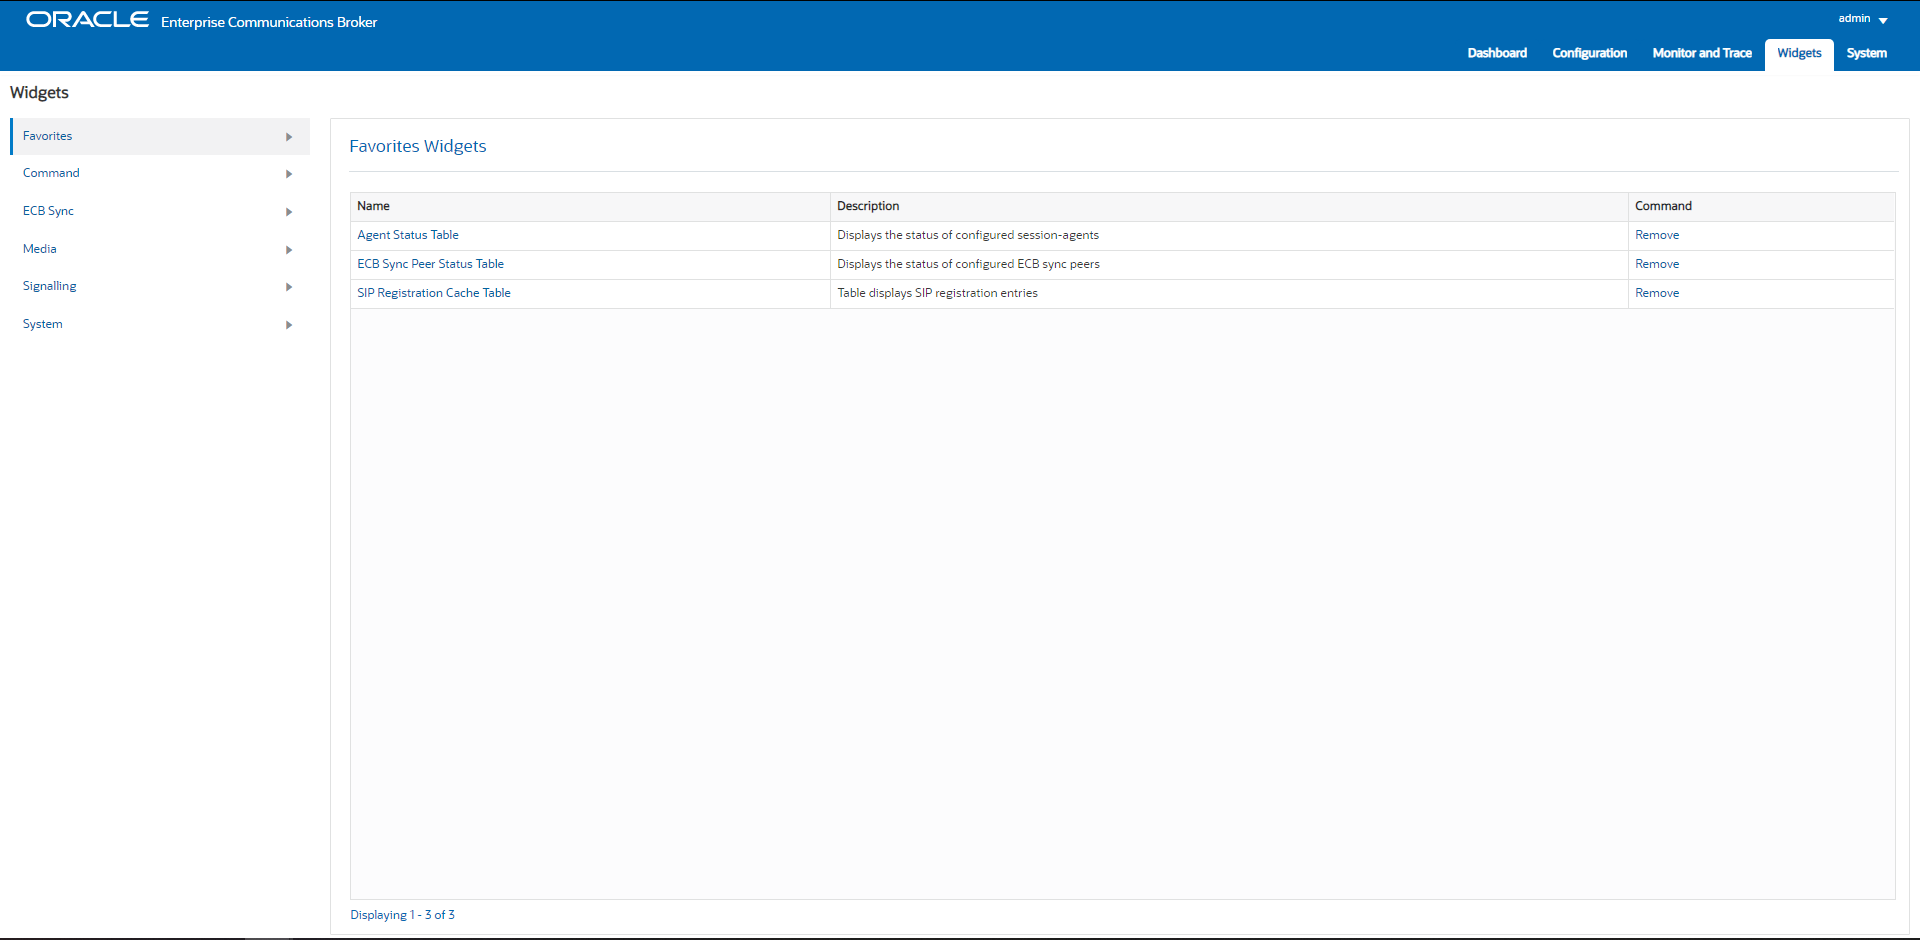
The Widgets page displays a categorical list of widgets in the left-hand navigation pane and provides their descriptions in the center pane along with the corresponding ACLI show command, when one exists. You can populate the Favorite Widgets list with the widgets that you use the most often. The following screen capture shows the Widgets page display.

Some widgets display static information, while others display actionable information. For example, the IP Connections widget displays a static list of internet connections, and the Licenses widget displays a list of licenses along with controls to Add and Delete licenses. Some widgets immediately display any available information when you click the name of the widget, for example, Configuration Inventory. Other widgets require you specify a few settings before displaying information, for example, Agent Individual. Most widgets allow you to set the Auto Refresh Interval.
Each Widget displays the particular controls used for its purpose. The following table lists all of the possible Widget controls and describes their purpose. The system displays a variable set of tool icons at the right-side top of Widgets. You click these icons to set the controls that each widget supports.
Actions performed using these icons are described in the following table.
| Tool | Description |
|---|---|
| Refresh | Update the data in the Widget. |
| Settings | Set the display settings per widget.
Settings vary per widget, and can include:
|
| Export | Send the contents to a file and download it to your system. |
| Add to Dashboard | Add the Widget to the dashboard. |
| Add to Favorites | Add the widget to the Favorite Widgets list. |
| Show Information | Displays a short description of the current widget. |
Widgets and Descriptions
For each show command that you can use from the ACLI to see ECB Sync, Media, Signaling, and System data about the Oracle Enterprise Communications Broker (OECB), the system provides a corresponding Widget on the Web GUI. Widgets display the data in a graphical or textual format.
A Widget can display a table, text, a pie graph, or a line graph depending on the type of data and the purpose of the display. For example, the SIP Realms All widget displays an actionable table and the Recording widget displays static text. You can access the list of widgets from either the navigation pane on the Monitoring tab or from the Home page by clicking Add Widget.
Note:
You must set up a valid SIP configuration before the OECB can display any SIP data in a Widget, including the default Widgets.Note:
The following tables list the Widgets in the same order as displayed on the GUI, which is not alphabetical.ECB Sync
| Widget | Show Command | Description |
|---|---|---|
| ECB Sync Peer Status Table | No show command | Displays the sync state and uptime for both the transmitter and the receiver. |
Media
| Widget | Show Command | Description |
|---|---|---|
| NAT By Index | show nat by-index | Displays the specified range of entries in the NAT table, with a maximum of 5024 entries. The default range is 1-200. The range corresponds to the line numbers in the table, not to the number of the entry. |
| NAT in Tabular | show nat in-tabular | Displays a specified range of entries in the NAT table. |
Signaling
| Widget | Show Command | Description |
|---|---|---|
| DNS | show dns | Displays statistics for the DNS configuration. |
| ENUM | show enum | Displays ENUM statistics. |
| LDAP | show ldap | Displays LDAP statistics. |
| LRT | show lrt | Displays the Local Routing Table statistics. |
| Registration by Realm | show registration sipd by realm | Displays calls that registered through a specified ingress realm for which you want to view cache information. |
| SIP ECB Registration Cache | show registration sipd by-realm <realm id> | Displays user and contact information. |
| ECB Sync Remote Registration | spl show sip ecb-sync registrations | Displays the address of record for the sync agent. |
| Registration SIP | show registration SIP | Displays SIP registrations. |
| Registration Statistics | show registration statistics | Displays a table of counters showing the total and periodic number of registrations by protocol. |
| Sessions | show sessions | Displays the session capacity for license and session use. |
| Agent Details | show sipd agents | Displays statistics related to defined DIP session agents. |
| Agent Groups | show sipd groups | Displays cumulative information for all session agent groups. |
| Agent Individual | show sipd agents <agent name> | Displays statistics related to the specified SIP session agent. |
| Agent Status Table | show sipd agents-status | Displays the state of the agent and active inbound and outbound calls. |
| Client Trans | show sipd client | Displays statistics for SIP client events when the SBC is acting as a SIP client in the B2BUA role. |
| SIP Errors | show sipd errors | Displays statistics for SIP media event errors. |
| Interface Individual | show sipd interface | Displays SIP interface statistics for the specified realm. |
| Interface Summary | show sipd interface | Displays all SIP interface statistics. |
| Method Ack | show sipd ack | Displays all SIP ACK method statistics. |
| Method Bye | show sipd bye | Displays the SIP BYE method statistics. |
| Method Cancel | show sipd cancel | Displays all SIP CANCEL method statistics. |
| Method Info | show sipd info | Displays the SIP INFO method statistics. |
| Method Invite | show sipd invite | Displays the SIP INVITE method statistics. |
| Method Message | show sipd message | Displays the SIP MESSAGE statistics. |
| Method Notify | show sipd notify | Displays the SIP NOTIFY statistics. |
| Method Options | show sipd options | Displays the SIP OPTIONS statistics. |
| Method Prack | show sipd prack | Displays the SIP PRACK method statistics. |
| Method Publish | show sipd publish | Displays the SIP PUBLISH method statistics. |
| Method Refer | show sipd refer | Displays the SIP REFER method statistics. |
| Method Register | show sipd register | Displays the SIP REGISTER method statistics. |
| Method Subscribe | show sipd SUBSCRIBE | Displays the SIP SUBSCRIBE method statistics. |
| Method Update | show sipd update | Displays the SIP UPDATE method statistics. |
| SIP Realms All | show sipd realms | Displays realm statistics related to SIP processing. |
| SIP Realms Individual | show sipd realms <realm name> | Displays realm statistics related to SIP processing for the specified realm. |
| SIP Redundancy | show sipd redundancy | Displays information about SIP redundancy. |
| Server Trans | show sipd server | Displays statistics for SIP server events when the SBC acts as a SIP server in the B2BUA role. |
| SIP Sessions All | show sipd sessions all | Displays all SIP sessions currently on the system. |
| Forked Sessions | show sipd forked | Displays forked sessions statistics. |
| SIP Sessions | show sipd sessions | Displays the number of sessions and dialogs in various states for the Period and Lifetime spans. |
| SIP Status | show sipd status | Displays information about SIP transactions. |
System
| Widget | Show Command | Description |
|---|---|---|
| Accounting | show accounting | Displays a summary of statistics for configured external accounting servers. |
| ACL | show acl all | Displays cumulative and per-interface statistics on ACL traffic and drops, displaying Recent, Total, and PerMax counts. The display also separates traffic from trusted from untrusted sites. |
| Alarms | show alarms | Displays existing alarms and allows you to clear them. |
| Authentication RADIUS | show radius all | Displays the status of established RADIUS accounting connections. |
| Authentication TACACS | show tacacs stats | Displays statistics related to communications between the OECB and configured TACACS servers . |
| Communications Monitor Errors | show comm-monitor errors | Displays Communications Monitor aggregate error statistics information. |
| Communications Monitor Internal | show comm-monitor internal | Displays Communications Monitor aggregate internal statistics information. |
| Communications Monitor Stats | show comm-monitor stats | Displays statistics related to connections between the OECB Communications Monitor probe and any configured Communications Monitor servers. |
| Editing Configuration | show configuration | Displays the current editing configuration. |
| Editing Configuration Short | show configuration short | Displays only the parameters that you modified in the editing configuration. |
| Configuration Inventory | show configuration inventory | Displays the editing and running configuration inventory of all configured elements. |
| Running Configuration | show running-config | Displays the current running configuration. |
| Running Configuration Short | show running-config short | Displays only the parameters that you modified in the running configuration. |
| Configuration Version | show version | Displays the configuration version number table. |
| Highest Task CPU Usage Line Graph | No show command | Displays a line graph with 5-10 tasks with the highest CPU usage in percent, during a specific period of time. |
| Highest Task CPU Usage Table | No show command | Displays a table with 5-10 tasks with the highest CPU usage in percent, during a specific period of time. |
| Current Disk Usage Pie Graph | No show command | Displays the current disk usage in a pie graph. |
| Current Disk Usage Table | No show command | Displays the current disk usage in a table. |
| Features | show features | Displays the features that are currently enabled, based on added licenses. |
| Interfaces | show interfaces | Displays all of the information concerning the rear interfaces. |
| Interfaces Brief | show interfaces brief | Displays key running statistics about the rear interfaces in one graphic. |
| Interface Mapping | show interface mapping | Displays the configured physical interfaces with their MAC addresses and label. |
| Virtual Interfaces | show virtual interfaces | Displays the virtual interfaces for signaling services. |
| Wancom | show Wancom | Displays negotiated duplex mode and speed for all system control interfaces. |
| ARP Info | show arp info | Displays the current Internet-to-Ethernet address mappings in the ARP table. |
| ARP Statistics | show arp statistics | Displays ARP statistics. |
| ARP Summary | show arp | Displays the current Internet-to-Ethernet address mappings in the ARP table. |
| IP Connections | show ip connections | Displays all TCP and UDP connections. |
| Neighbor Table | show neighbor table | Displays the IPv6 neighbor table and validates that an entry for the link local address exists and that the gateway uses that MAC address. |
| Routes | show routes | Displays the current system routing table. |
| IP Summary | show ip | Displays IP statistics. |
| IP TCP | show ip tcp | Displays all TCP statistics. |
| IP UDP | show ip udp | Displays all UDP statistics. |
| Licenses | license | Displays existing licenses and allows you to add or delete them. |
| Current Memory Usage Pie Graph | No show command | Displays the current percentage of free and allocated memory in a pie graph. |
| Current Memory Usage Table | No show command | Displays the current percentage of free and allocated memory in a table. |
| Historical Memory Usage Line Graph | No show command | Displays a line graph of the kilobytes of free and allocated memory over a period of time. |
| Historical Memory Usage Table | No show command | Displays a table of the kilobytes of free and allocated memory over a period of time. |
| Memory Summary | show memory | Displays statistic related to the memory. |
| Platform All | show platform all | Displays full platform information. |
| Platform CPU load | show platform cpu-load | Displays current CPU load. |
| Platform Errors | show platform errors | Displays service pipe write errors. |
| Platform Limits | show platform limits | Displays platform related limits. |
| Processes | show processes | Displays statistics for all active processes. |
| SNMP Community Table | show snmp-community-table | Displays all information for configured SNMP communities including requests and responses for each community. |
| Trap Receiver | show trap-receiver | Displays trap receiver information for each configured SNMP community. |
| SPL Memory | show spl memory | Displays SPL memory for each task SPL engine. |
| SPL Options | show spl-options | Displays information on all SPL options. |
| SPL Statistics | show spl statistics | Displays statistics for all tasks. |
| SPL Version | show spl | Displays the version of the SPL engine. |
| System Health | show health | Displays the system health table for HA pairs. |
| Clock | show clock | Displays the current date and time. |
| NTP Server | show ntp server | Displays information about the quality of the time used for offset and the delay measurement maximum error bounds. |
| NTP Status | show ntp status | Displays information about configuration status, NTP daemon synchronization, NTP synchronization in process, and if NTP is not responding. |
| Time Zone | show timezone | Displays the time zone. |
| Clock UTC | show clock utc | Displays the current date and time in Coordinated Universal Time (UTC). |
| Uptime | show uptime | Displays information about the length of time the system has been running in days, hours, and seconds. Also displays the current date and time information. |
| User Management | show users | Displays a table that lists all users currently logged on to the system. |
| Version Boot | show version boot | Displays the boot version. |
| Version CPU | show version cpu | Displays the CPU version. |
| Version Hardware | show version hardware | Displays the hardware version. |
| Version Image | show version image | Displays the image version. |
| Version Summary | show version | Displays the Operating System version information, including the OS version number, the manufacturing date of the current version, and other details. |
Command Line Interface Widgets
Like many devices, the Oracle Enterprise Communications Broker (OECB) includes an underlying management interface called the Command Line Interface (CLI). Support technicians use the CLI to display detailed information about the system in text format. Oracle makes this information available from the graphical user interface (GUI) with CLI Widgets, available from the OECB Widget page. The CLI Widgets can provide useful troubleshooting information, as well as insight into system operations.
To reach the CLI portal, go to the Widgets tab, Command, Command Line Portal. When you click the CLI portal link, the OECB displays the Settings page.
CLI portal settings include:
| Command | A drop-down list where you choose the CLI command. |
| Parameter | A text box where you enter additional parameter text to refine the command output with a command argument. |
| Auto-refresh Interval | A drop-down list where you specify how often the system refreshes the widget's data. Default: Never. Valid values: Never | 30 |40 | 50 | 60. |
The portal includes an OK button and a Cancel button. When you click OK, the system displays the output of the command.
The system produces two types of CLI widgets, depending on the command invoked:
- Text Display—The system displays the output of the command in an all-text format.
- Tabular Display—The system displays the output of these commands in a table.
Licenses Widget
The Licenses widget on the Web GUI provides a workspace where you can view, add, and delete Oracle Enterprise Communications Broker (OECB) licenses.
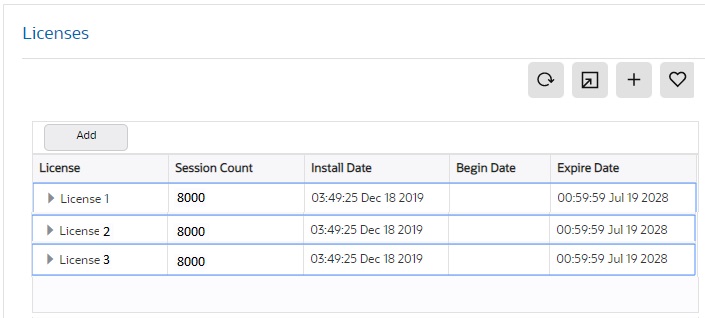
On the Widgets tab click the System link, and then click Licenses. The following screen capture shows and example of the Licenses page, which displays the license name, the entitled number of sessions, the installation date, the begin date, and the expire date.

The License widget includes the same toolbar in the top, right-hand corner that Widgets on the Dashboard display. Note that the License widget does not include the Settings icon and the Auto-refresh function because these operations do not apply to licenses.
| License | The name of the license. |
| Session Count | The number of session entitlements for the license. |
| Install Date | The date when the license is added to the system. |
| Begin Date | The date when the license begins service. |
| Expire Date | The date when the license ends service. |
If you want to see the details of a particular license, click the twister by the license name to expand the view to show all of the details, which display in text below the selected license. The text states the number of allowed sessions and lists all of the features included in the license.. The following screen capture shows an example of license details.

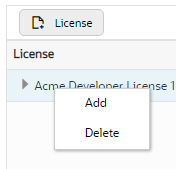
The Licenses widget provides controls to Add and Delete licenses, when you right-click a license.

When you click Add, the system displays the License dialog, where you enter the license serial number.

When you select a license from the Licenses list and click Delete, the system displays the delete Confirmation dialog.
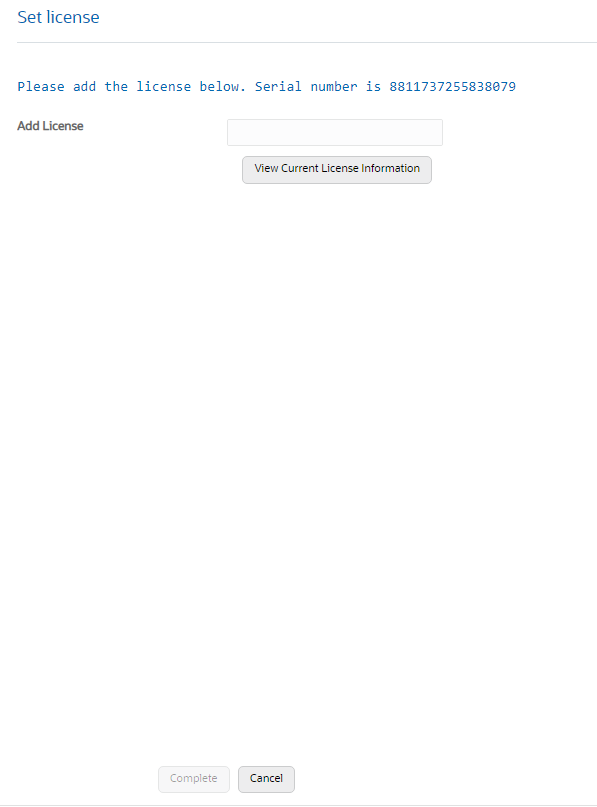
The Set License function, located under the System tab and System Operations links, is linked to the License widget, so that you can view your licenses from the Set License dialog. After launching Set License, use the "View current license information" button in the Set License dialog to see a view-only list of your OECB licenses.
The only operations allowed in view mode are Refresh and Download.