Monitor Messages Per Second
The Converged Application Server allows you to monitor the messages per second (MPS) sent or received by your application to align with your licensed capacity. With a default 12-month historic MPS retention, you can audit usage trends and plan adjustments to your MPS license.
See the "MPS License Metric Definition" section of the License Document for a detailed definition of the MPS metric.
- Messages between the Converged Application Server SIP Servlet applications in the same managed node (SIP Engine,
JVM), regardless of:
- Messages routed via the local network interface
- Messages passed as java objects
- Messages sent to or received from observability and monitoring tools, continuous delivery tooling, configuration tools including REST API for configuration, and other tools used to monitor and operate the Converged Application Server environment
- Diameter Connection Control messages
- Messages rejected/dropped by the overload protection feature
- MPS—The number of messages per second received from or sent to external servers.
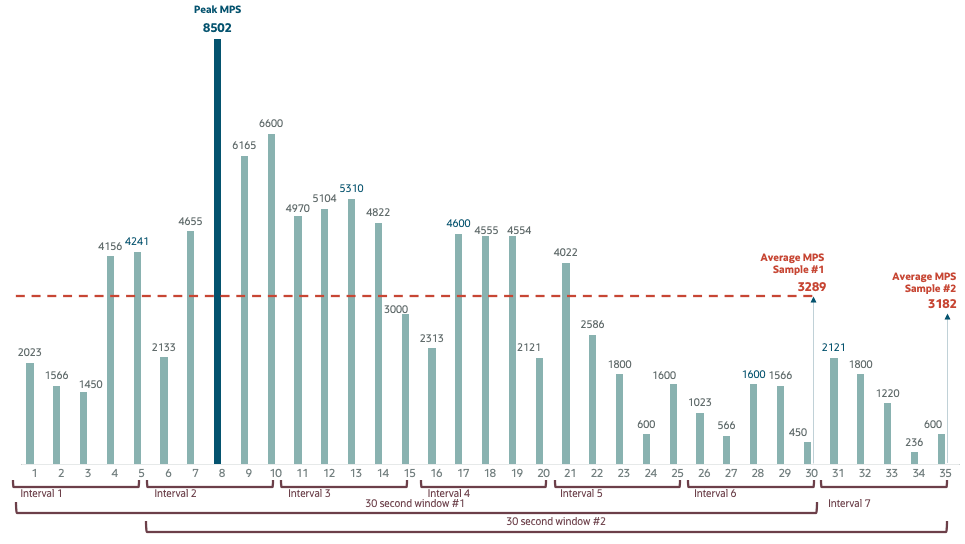
- Peak MPS—The highest Messages Per Second value during a 30-second window.
- Sampling Rate—Interval duration. By default, set to 5 seconds. The cumulative value of the number of messages for an interval duration is stored in an array. The array has six positions, hence creating a 30 second window.
- Average MPS—The average number of messages
per second computed over a rolling 30 second window using the ceiling function
(rounding to the next whole number).
For example, given the sampling rate of 5 seconds, then the Converged Application Server calculates the average MPS over a 30 second sliding window. The first sample (of average MPS) covers 0 - 30 seconds, the second sample covers 5 - 35 seconds, the third sample covers 10 - 40 seconds, and so on.
The following graph shows the Peak MPS and Average MPS for two consecutive 30 second windows. The Peak MPS is the same for both windows, namely 8502. The Average MPS however is different for each window: 3289 for the first window and 3182 for the second window.

- Retention Window—A 5 minute period during which the average MPS samples are retained in an internal buffer in memory. In total 60 average MPS values are stored in the internal buffer. From these 60 the highest value is stored for long term retention.
- Peak Average MPS—The highest number of
average MPS values over the retention window.
In the following example data set, the peak of the average MPS is 2542 within this 5 minute retention window. (All the other sample values are below 2542.)
Time Sample Average MPS 1 - 30 seconds 1 2534 5 - 35 seconds 2 2530 10 - 40 seconds 3 2515 15 - 45 seconds 4 2519 . . . . . . . . . 4 mins 25 sec - 4 mins 55 sec 59 2540 4 mins 30 sec - 5 mins 60 2542 In this example, the next retention window starts at 5 mins 00 seconds. With the first averaged peak value written at 5 minutes 05 seconds using the before-mentioned array. Hence the values of the 5 previous intervals are used to determine the average peak for the 5 minutes 00 seconds to 5 mins 05 second interval and so on. The array is not emptied at the end or start of a retention window.
- Licensed Peak Average MPS—Your licensed MPS
number.
The Converged Application Server checks the retention window every 5 minutes for peak average MPS values that exceed your licensed peak MPS.
If the peak average MPS value exceeds the threshold limit, the Converged Application Server logs the alarm in the console log and updates the MPSConfig descriptor bean attribute BreachInfo with the message "Threshold limit crossed during period <FROMDATE> and <TODATE>".
Note:
After a restart or reboot of the Admin Server, the Average MPS count is inaccurate for the first 30 seconds and first retention window. The first Average MPS and the Peak Average MPS must be ignored. This also includes any MPS value threshold crossing alarms within the first retention window, which must be ignored as well.The directory <DOMAIN_HOME>/servers/logs/MPS
contains files called MPS_<MM-dd-YYYY>.csv that contains the
start time, end time, and peak average MPS. This file is rotated daily. Files in this
directory that are older than the Historic MPS Persistency value
are purged.
Note:
Use the Historic MPS Persistency value to limit how much disk space is devoted to MPS logs.Known Issue
The MPS monitoring function currently only records SIP and Diameter messages.