Creating a New Metric Extension
To create a new metric extension:
- From the Enterprise menu, select Monitoring, then select Metric Extensions.
- From the Create menu, select Metric Extension. Enterprise Manager will determine whether you have the Create Extension privilege and guide you through the creation process.
- Decide on a metric extension name. Be aware that the name (and Display Name) must be unique across a target type.
- Enter the general parameters.
The selected Adapter type defines the properties you must specify in the next step of the metric extension wizard. The following adapter types are available:
-
OS Command Adapter - Single Column
Executes the specified OS command and returns the command output as a single value. The metric result is a 1 row, 1 column table.
-
OS Command Adapter- Multiple Values
Executes the specified OS command and returns each command output line as a separate value. The metric result is a multi-row, 1 column table.
-
OS Command Adapter - Multiple Columns
Executes the specified OS command and parses each command output line (delimited by a user-specified string) into multiple values. The metric result is a mult-row, multi-column table.
-
SQL Adapter
Executes custom SQL queries or function calls against single instance databases and instances on Real Application Clusters (RAC).
-
SNMP (Simple Network Management Protocol) Adapter
Allow Enterprise Manager Management Agents to query SNMP agents for Management Information Base (MIB) variable information to be used as metric data.
-
JMX (Java Management Extensions) Adapter
Retrieves JMX attributes from JMX-enabled servers and returns these attributes as a metric table.
Refer to the Adapters section for specific information on the selected adapter needed in the Adapter page (step 2) of the wizard.
Note:
Be aware that if you change the metric extension Adapter, all your previous adapter properties (in Step 2) will be cleared.
Collection Schedule
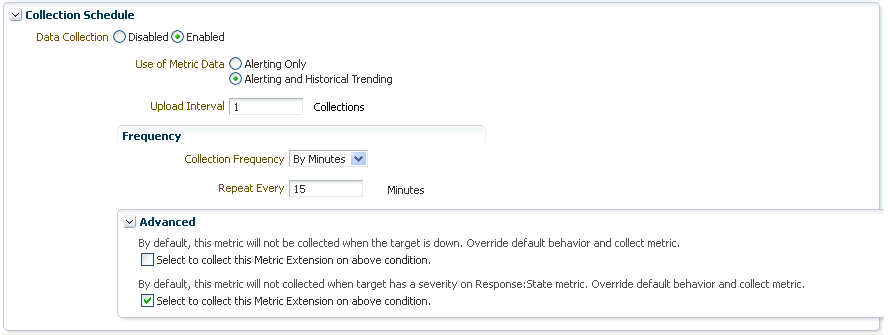
You defined the frequency with which metric data is collected and how it is used (Alerting Only or Alerting and Historical Trending) by specifying collection schedule properties.
Depending on the target type selected, an Advanced option region may appear. This region may (depending on the selected target type) contain one or two options that determine whether metric data continues to be collected under certain target availability/alert conditions. The options are:
-
Option 1: Continue metric data collection even if the target is down. This option is visible for all target types except for Host target types as it is not possible to collect metric data when the host is down.
-
Option 2: Continue metric data collection when an alert severity is raised for a specific target metric. This metric is defined in such a way (AltSkipCondition element is defined on this metric) that when a severity is generated on this metric, the metric collections for other target metrics are stopped. The explanatory text above the checkbox for this option varies depending on the selected target type.
The Management Agent has logic to skip evaluation of metrics for targets that are known to be down to reduce generation of metric errors due to connection failures. If the AltSkipCondition element is defined for that target metric, other metrics are skipped whenever there is an error in evaluating the Response metric or there is a non-clear severity on the Response:Status metric. There are two situations where a metric collection will be skipped or not happen:
-
When a target is down (option 1). This is same as the Severity on Response/Status metric.
-
When a target is UP, but there is a severity on any other metric. Such conditions are called Alt Skip (Alternate Skip) conditions.
Option 2 is only visible if an AltSkipCondition defined for one of the target's metrics. For example, this option will not be visible if the selected target type is Oracle Weblogic Domain, but will be visible if the selected target type is Database Instance.
The following graphic shows the Advanced collection schedule options.

-
-
- From the Columns page, add metric columns defining the data returned from the adapter. Note that the column order should match the order with which the adapter returns the data.
-
Column Type
A column is either a Key column, or Data column. A Key column uniquely identifies a row in the table. For example, employee ID is a unique identifier of a table of employees. A Data column is any non-unique data in a row. For example, the first and last names of an employee. You can also create rate and delta metric columns based on an existing data column. See Rate and Delta Metric Columns below.
Note:
Key columns might contribute to the creation of a large number of unique keys, such as
metric_key_id, causing load on the repository.For example, Timestamp should not be a Key column, as it will create unique metric_key_id for each collection, and the existing metric_key_id and metric_item_id will no longer be reused.
-
Value Type
A value type is Number or String. This determines the alert comparison operators that are available, and how Enterprise Manager renders collection data for this metric column.
-
Alert Thresholds
The Comparison Operation, Warning, and Critical fields define an alert threshold.
-
Alert Thresholds By Key
The Comparison Operation, Warning Thresholds By Key, and Critical Thresholds By Key fields allow you to specify distinct alert thresholds for different rows in a table. This option becomes available if there are any Key columns defined. For example, if your metric is monitoring CPU Usage, you can specify a different alert threshold for each distinct CPU. The syntax is to specify the key column values in a comma separated list, the "=" symbol, followed by the alert threshold. Multiple thresholds for different rows can be separated by the semi-colon symbol ";". For example, if the key columns of the CPU Usage metric are cpu_id and core_id, and you want to add a warning threshold of 50% for procecessor1, core1, and a threshold of 60% for processor2, core2, you would specify: procecessor1,core1=50;processor2,core2=60
-
Manually Clearable Alert
Note:
You must expand the Advanced region in order to view the Manually Clearable Alert option.
If this option is set to true, then the alert will not automatically clear when the alert threshold is no longer satisfied. For example, if your metric is counting the number of errors in the system log files, and you set an alert threshold of 50, if an alert is raised once the threshold is met, the alert will not automatically clear once the error count falls back below 50. The alert will need to be manually cleared in the Alerts UI in the target home page or Incident Manager.
-
Number of Occurrences Before Alert
The number of consecutive metric collections where the alert threshold is met, before an alert is raised.
-
Alert Message / Clear Message
The message that is sent when the alert is raised / cleared. Variables that are available for use are: %columnName%, %keyValue%, %value%, %warning_threshold%, %critical_threshold%
You can also retrieve the value of another column by surrounding the desired column name with "%". For example, if you are creating an alert for the cpu_usage column, you can get the value of the core_temperature column by using %core_temperature%. Note that the same alert / clear message is used for warning or critical alerts.
Note:
Think carefully and make sure all Key columns are added, because you cannot create additional Key columns in newer versions of the metric extension. Once you click Save As Deployable Draft, the Key columns are final (edits to column display name, alert thresholds are still allowed). You can still add new Data columns in newer versions. Also be aware that some properties of existing Data columns cannot be changed later, including Column Type, Value Type, Comparison Operator (you can add a new operator, but not change an existing operator), and Manually Clearable Alert.
-
Metric Category
The metric category this column belongs to.
Rate and Delta Metric Columns
You can create additional metric columns based on an existing data column that measures the rate at which data changes or the difference in value (delta) since the last metric collection. The rate/delta metric definition will be allowed when a metric's collection frequency is periodic. For example, collected every 10 minutes. Converseley, a metric that is computed every Monday and Tuesday only cannot have a rate/delta metric as data sampling is too infrequent.
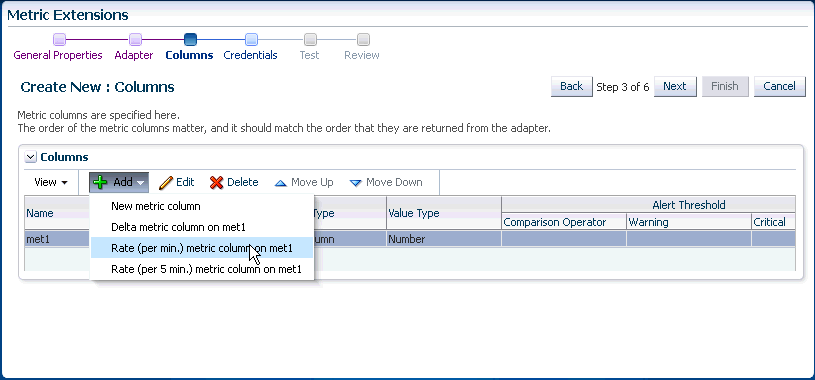
After at least one data column has been created, three additional options appear in the Add menu as shown in the following graphic.

-
Add Delta metric columns based on another metric column
Example: You want to know the difference in the table space used since the last collection.
Delta Calculation:
current metric value - previous metric value
-
Add Rate Per Minute metric column based on another metric column
Example: You want to know the average table space usage per minute based on the table space column metric which is collected every 1 hr.
Rate Per Minute Calculation:
(current metric value - previous metric value)/ collection schedule
where the collection schedule is in minutes.
-
Add Rate Per Five Minutes metric column based on another metric column
Example: You want to know the average table space usage every five minutes based on the table space column which is collected say every 1 hour]
Rate Per Five Minute Calculation:
[(current metric value - previous metric value)/ collection schedule ] * 5
where the collection schedule is in minutes.
To create a rate/delta metric column, click on an existing data column in the table and then select one of the rate/delta column options from the Add menu.
-
- From the Credentials page, you can override the default monitoring credentials by using custom monitoring credential sets. By default, the metric extension wizard chooses the existing credentials used by Oracle out-of-box metrics for the particular target type. For example, metric extensions will use the dbsnmp user for database targets. You have the option to override the default credentials, by creating a custom monitoring credential set through the "emcli create_credential_set" command. Refer to the Enterprise Manager Command Line Interface Guide for additional details. Some adapters may use additional credentials, refer to the Adapters section for specific information.
- From the Test page, add available test targets.
- Click Run Test to validate the metric extension. The extension is deployed to the test targets specified by the user and a real-time collection is executed. Afterwards, the metric extension is automatically undeployed. The results and any errors are added to the Test Results region.
- Repeat the edit /test cycle until the metric extension returns data as expected.
- Click Finish.