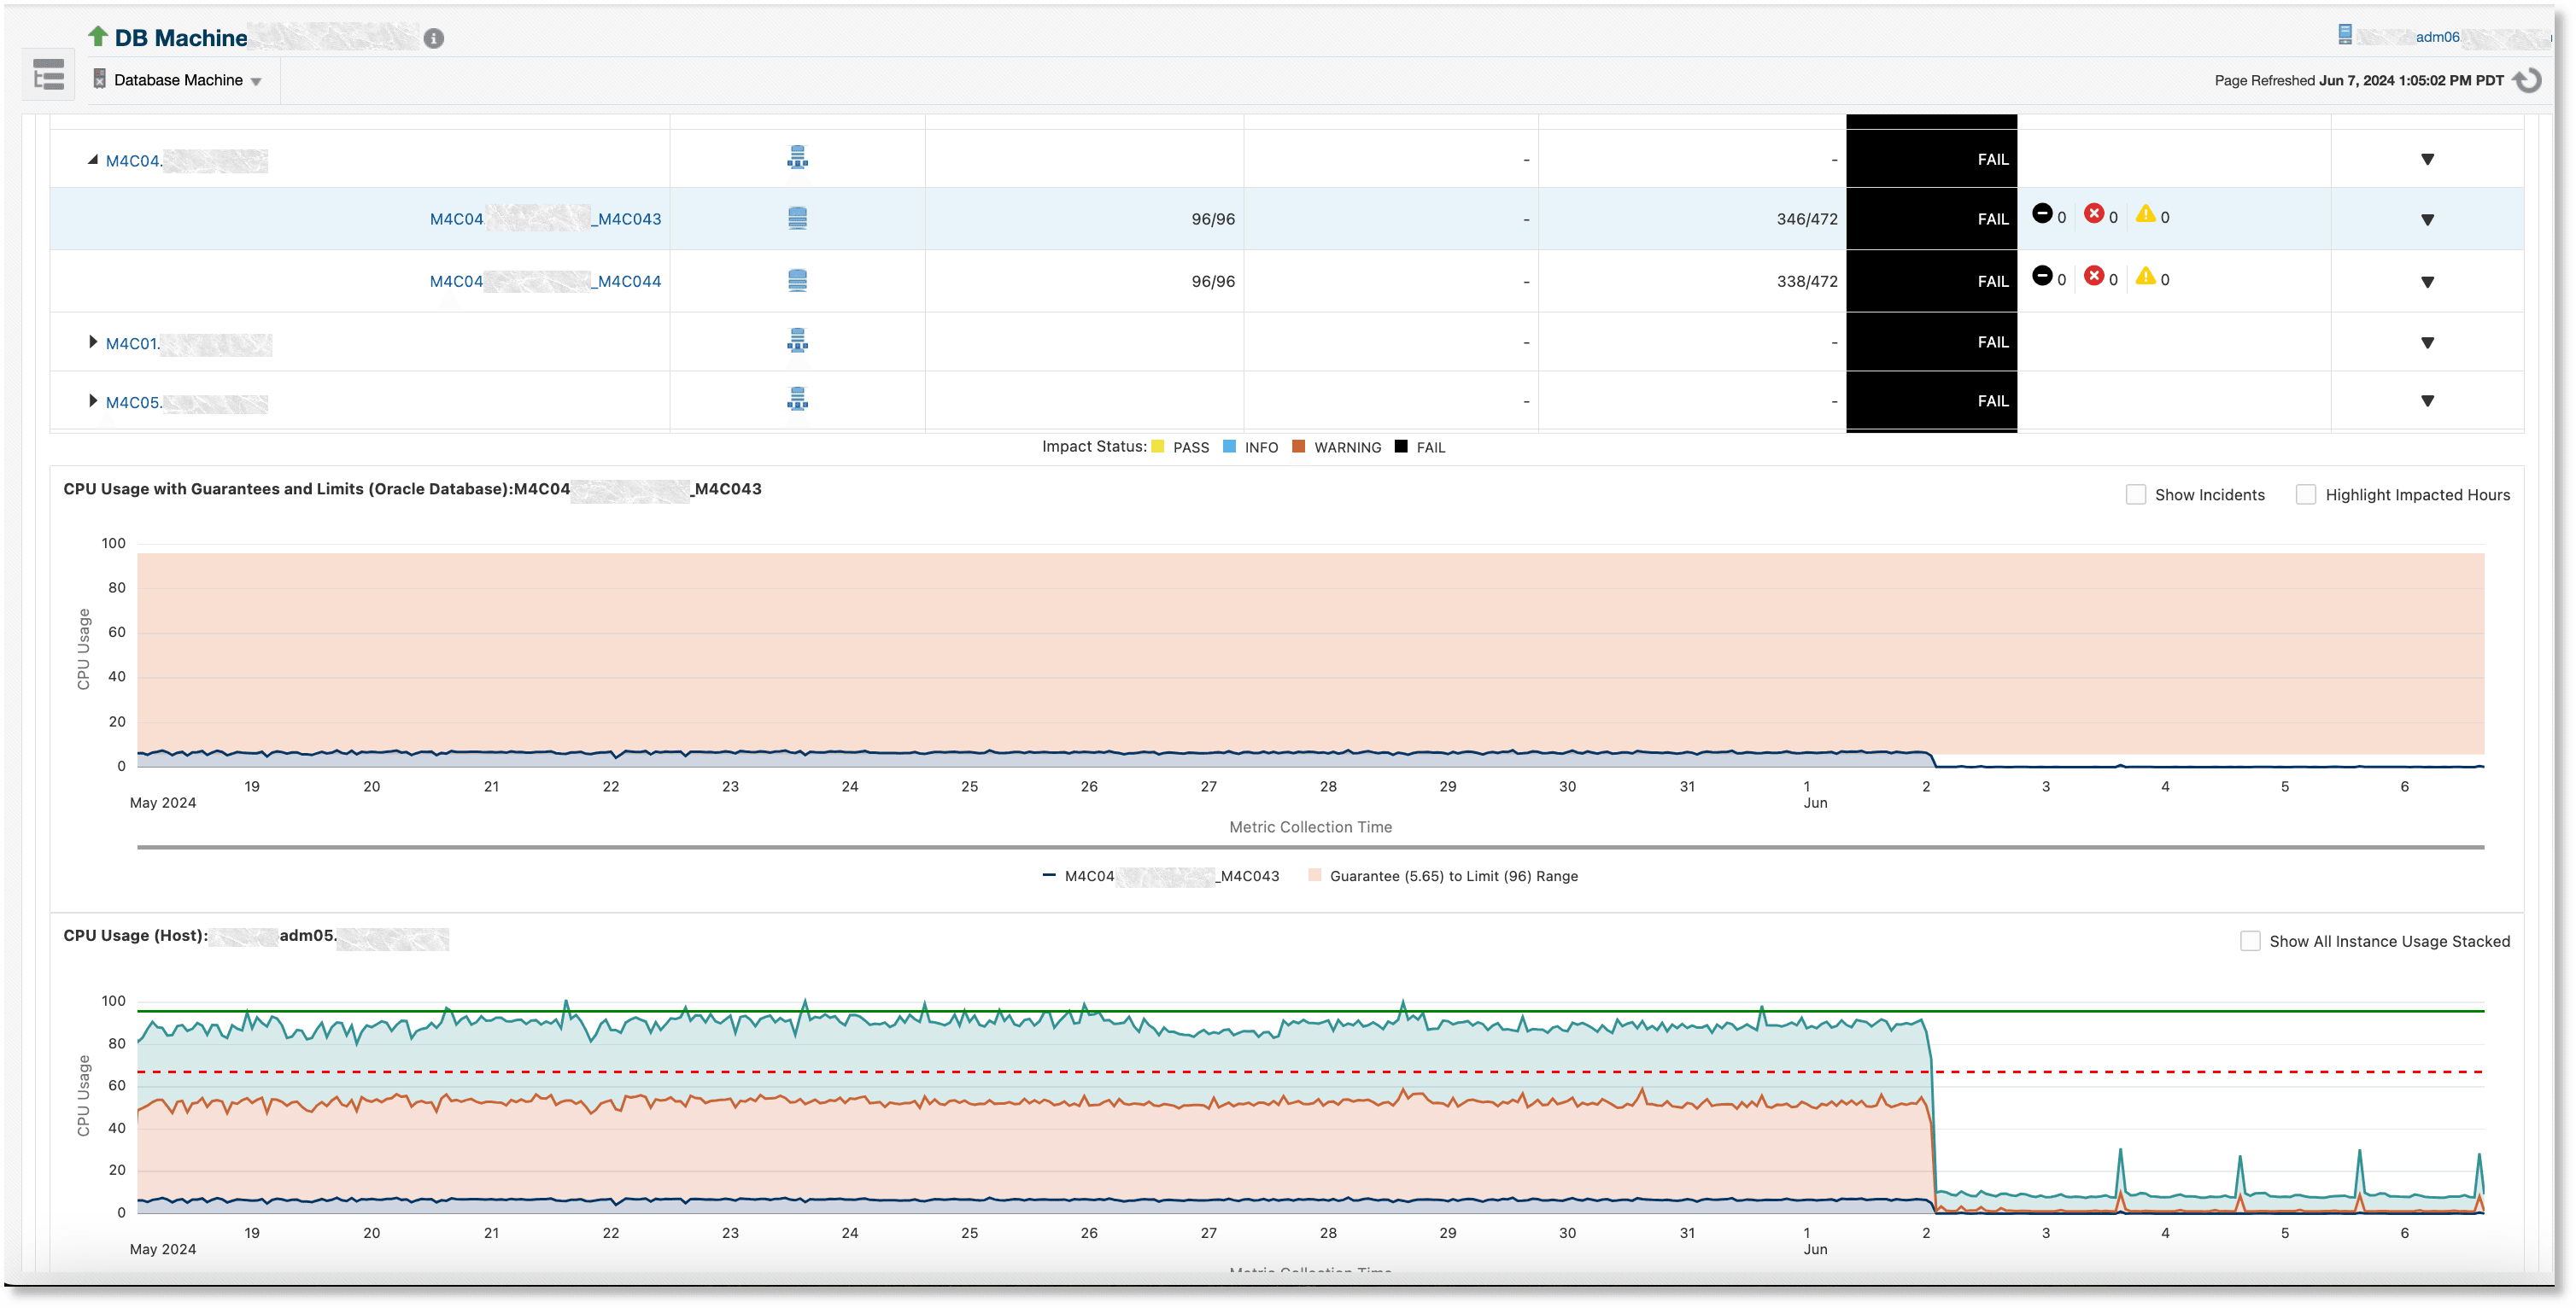
Impact Analysis for Database Instance
Click on a database instance in the table to see a historical plot of the CPU usage for the instance. Zoom into a time period that needs closer analysis. Impacted or exposed time periods can be easily correlated with incidents that are reported in the same time frame by selecting the Show Incidents option.

Select the Highlight Impacted Hours option on the CPU Usage with Guarantees and Limits (Oracle Database) chart to see when the CPU usage of the database instance is above 70% (red dotted-line) of total host CPU utilization.
To compare the CPU usage of the selected database instance against other instances (from other databases) running on the host, select the Show All Instance Usage Stacked option. If the aggregate stacked CPU usage of all instances is above the 70% threshold, it may indicate the presence of noisy-neighbor instances on the host, which can be further analyzed by deselecting the Show All Instance Usage Stacked option in order to examine the CPU usage of each individual instance running on the host. Conversely, if the aggregate stacked CPU usage of all instances running on the host is below 70% of total host CPU utilization during a period when the instance is impacted, meaning that the 70% threshold was met only after the addition of non-database process CPU usage, it may indicate that non-database processes are an impact factor.
