Create Federated Data Dashboards
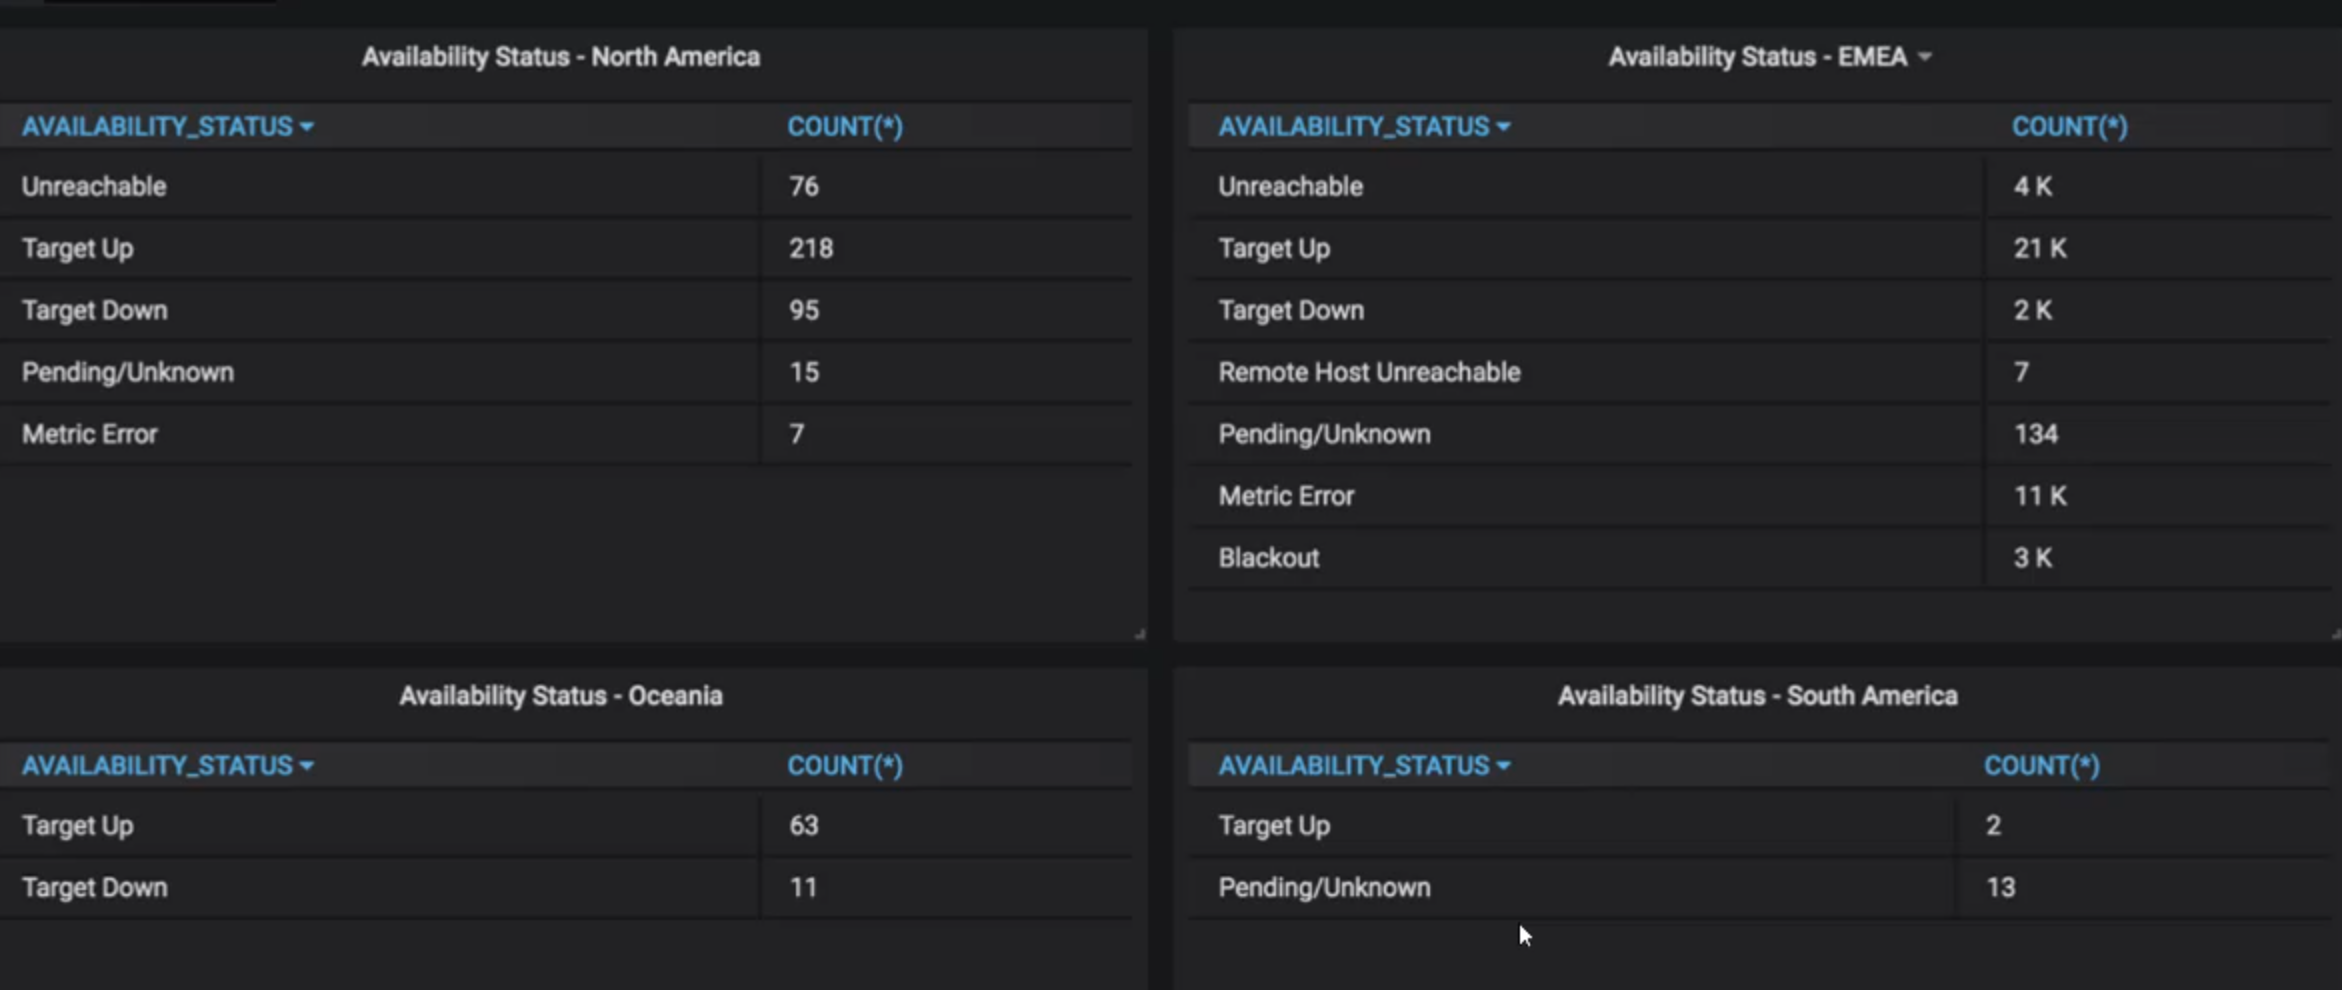
Grafana lets you unify monitoring data from multiple Enterprise Manager sites.
To visualize data across multiple sites:
- Query data for one Enterprise Manager site and save that visualization.
- Duplicate that panel, edit its data source to point to a new Enterprise Manager site.
- Rename it and publish it to the same dashboard.
For example, you can visualize availability data from two separate Enterprise Manager sites in different regions, as shown below.

To create a custom federated dashboard, you can use the pre-defined Multi-EM template.
When using the Multi-EM template, you'll need to do the following:
- In the General tab, select the Repeat option. This helps when the top-level site selection has multiple sites checked.
- Select only one Enterprise Manager site from the top-level selection.
- Set up a non-time series based query against a single repository within an Enterprise Manager instance.
- Replicate the same setup/query across other instances of Enterprise Manager that are enabled as Data Sources by selecting other Enterprise Manager instances from the drop-down.