9.6.1 oclumon analyze
Use the oclumon analyze command to analyze CHM metrics.
Syntax
oclumon analyze [-h] [-i CHM_METRICS_DIR] -o OUT_DIR [-l LOG_DIR] [--log_level {DEBUG,INFO,WARNING,ERROR}] [-s START_TIME] [-e END_TIME] [-f FORMAT] [--version]Parameters
Table 9-144 oclumon analyze Command Parameters
| Parameter | Description |
|---|---|
|
|
Specify the directory containing CHM metrics. |
|
|
Specify the output directory for the results. |
|
|
Specify the log directory. |
|
|
Specify the log level. |
|
|
Specify the start time for analysis in |
|
|
Specify the end time for analysis in |
|
|
Specify a comma-delimited report format ( |
|
|
Displays the program's version number and exits. |
Example 9-130 oclumon analyze Examples
oclumon analyze -o /<outpur-dir>oclumon analyze -o /<output-dir> -s 2024-03-14T05:00:00 -e 2024-03-14T05:15:00oclumon analyze -o /<output-dir> -f htmloclumon analyze -i /<chm-data-dir> -o /<output-dir>Example 9-131 Sample CHM Analysis Report
CHM analysis report contains following sections:
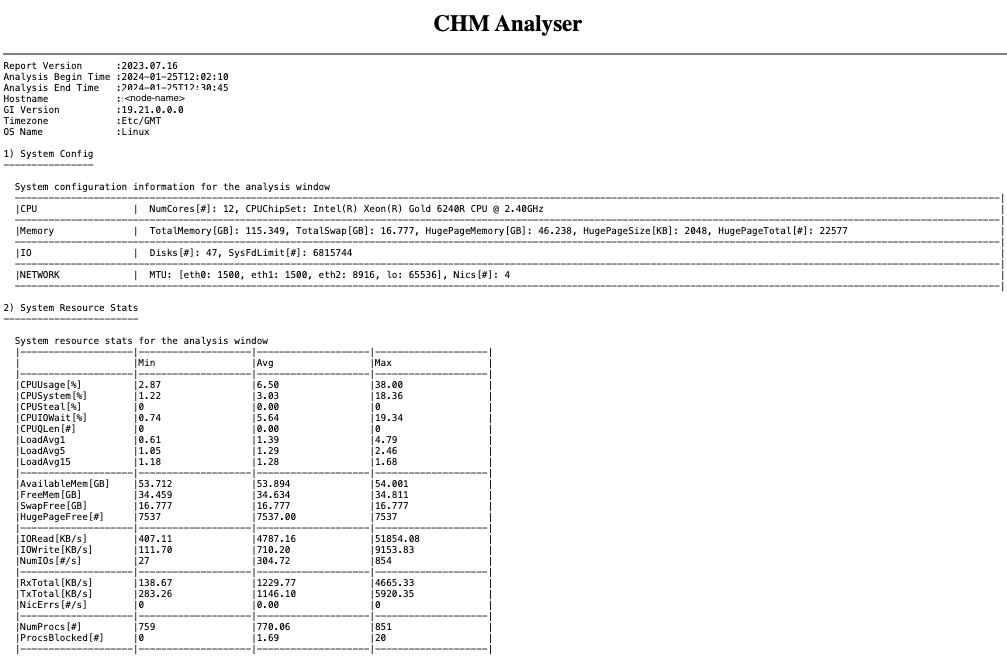
- Header section: Contains info about the node, analysis time period, system configuration and system resource stats.
Figure 9-3 System Configuration and System resource stats

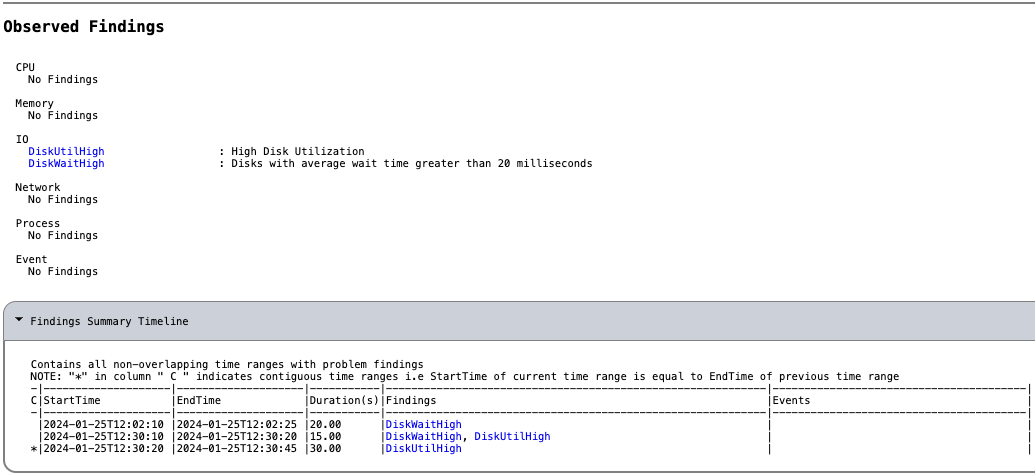
- Observed findings and findings summary timeline section: Contains the list of observed problems, along with a summary timeline of the problems.
Figure 9-4 Problematic findings and summary timeline

- Findings details section: Contains detailed contextual information for each of the problems observed above.
Figure 9-5 Problematic findings - details

Parent topic: OCLUMON Command Reference