3.2.3.7 System Changes
The System Changes dashboard provides visibility into system-level modifications — such as database parameter updates and configuration adjustments — across the fleet, over a selected time range.
- Track system modifications over time
- Assess the potential impact of changes on stability, performance, and compliance
- Identify clusters or nodes with unusual or frequent change patterns
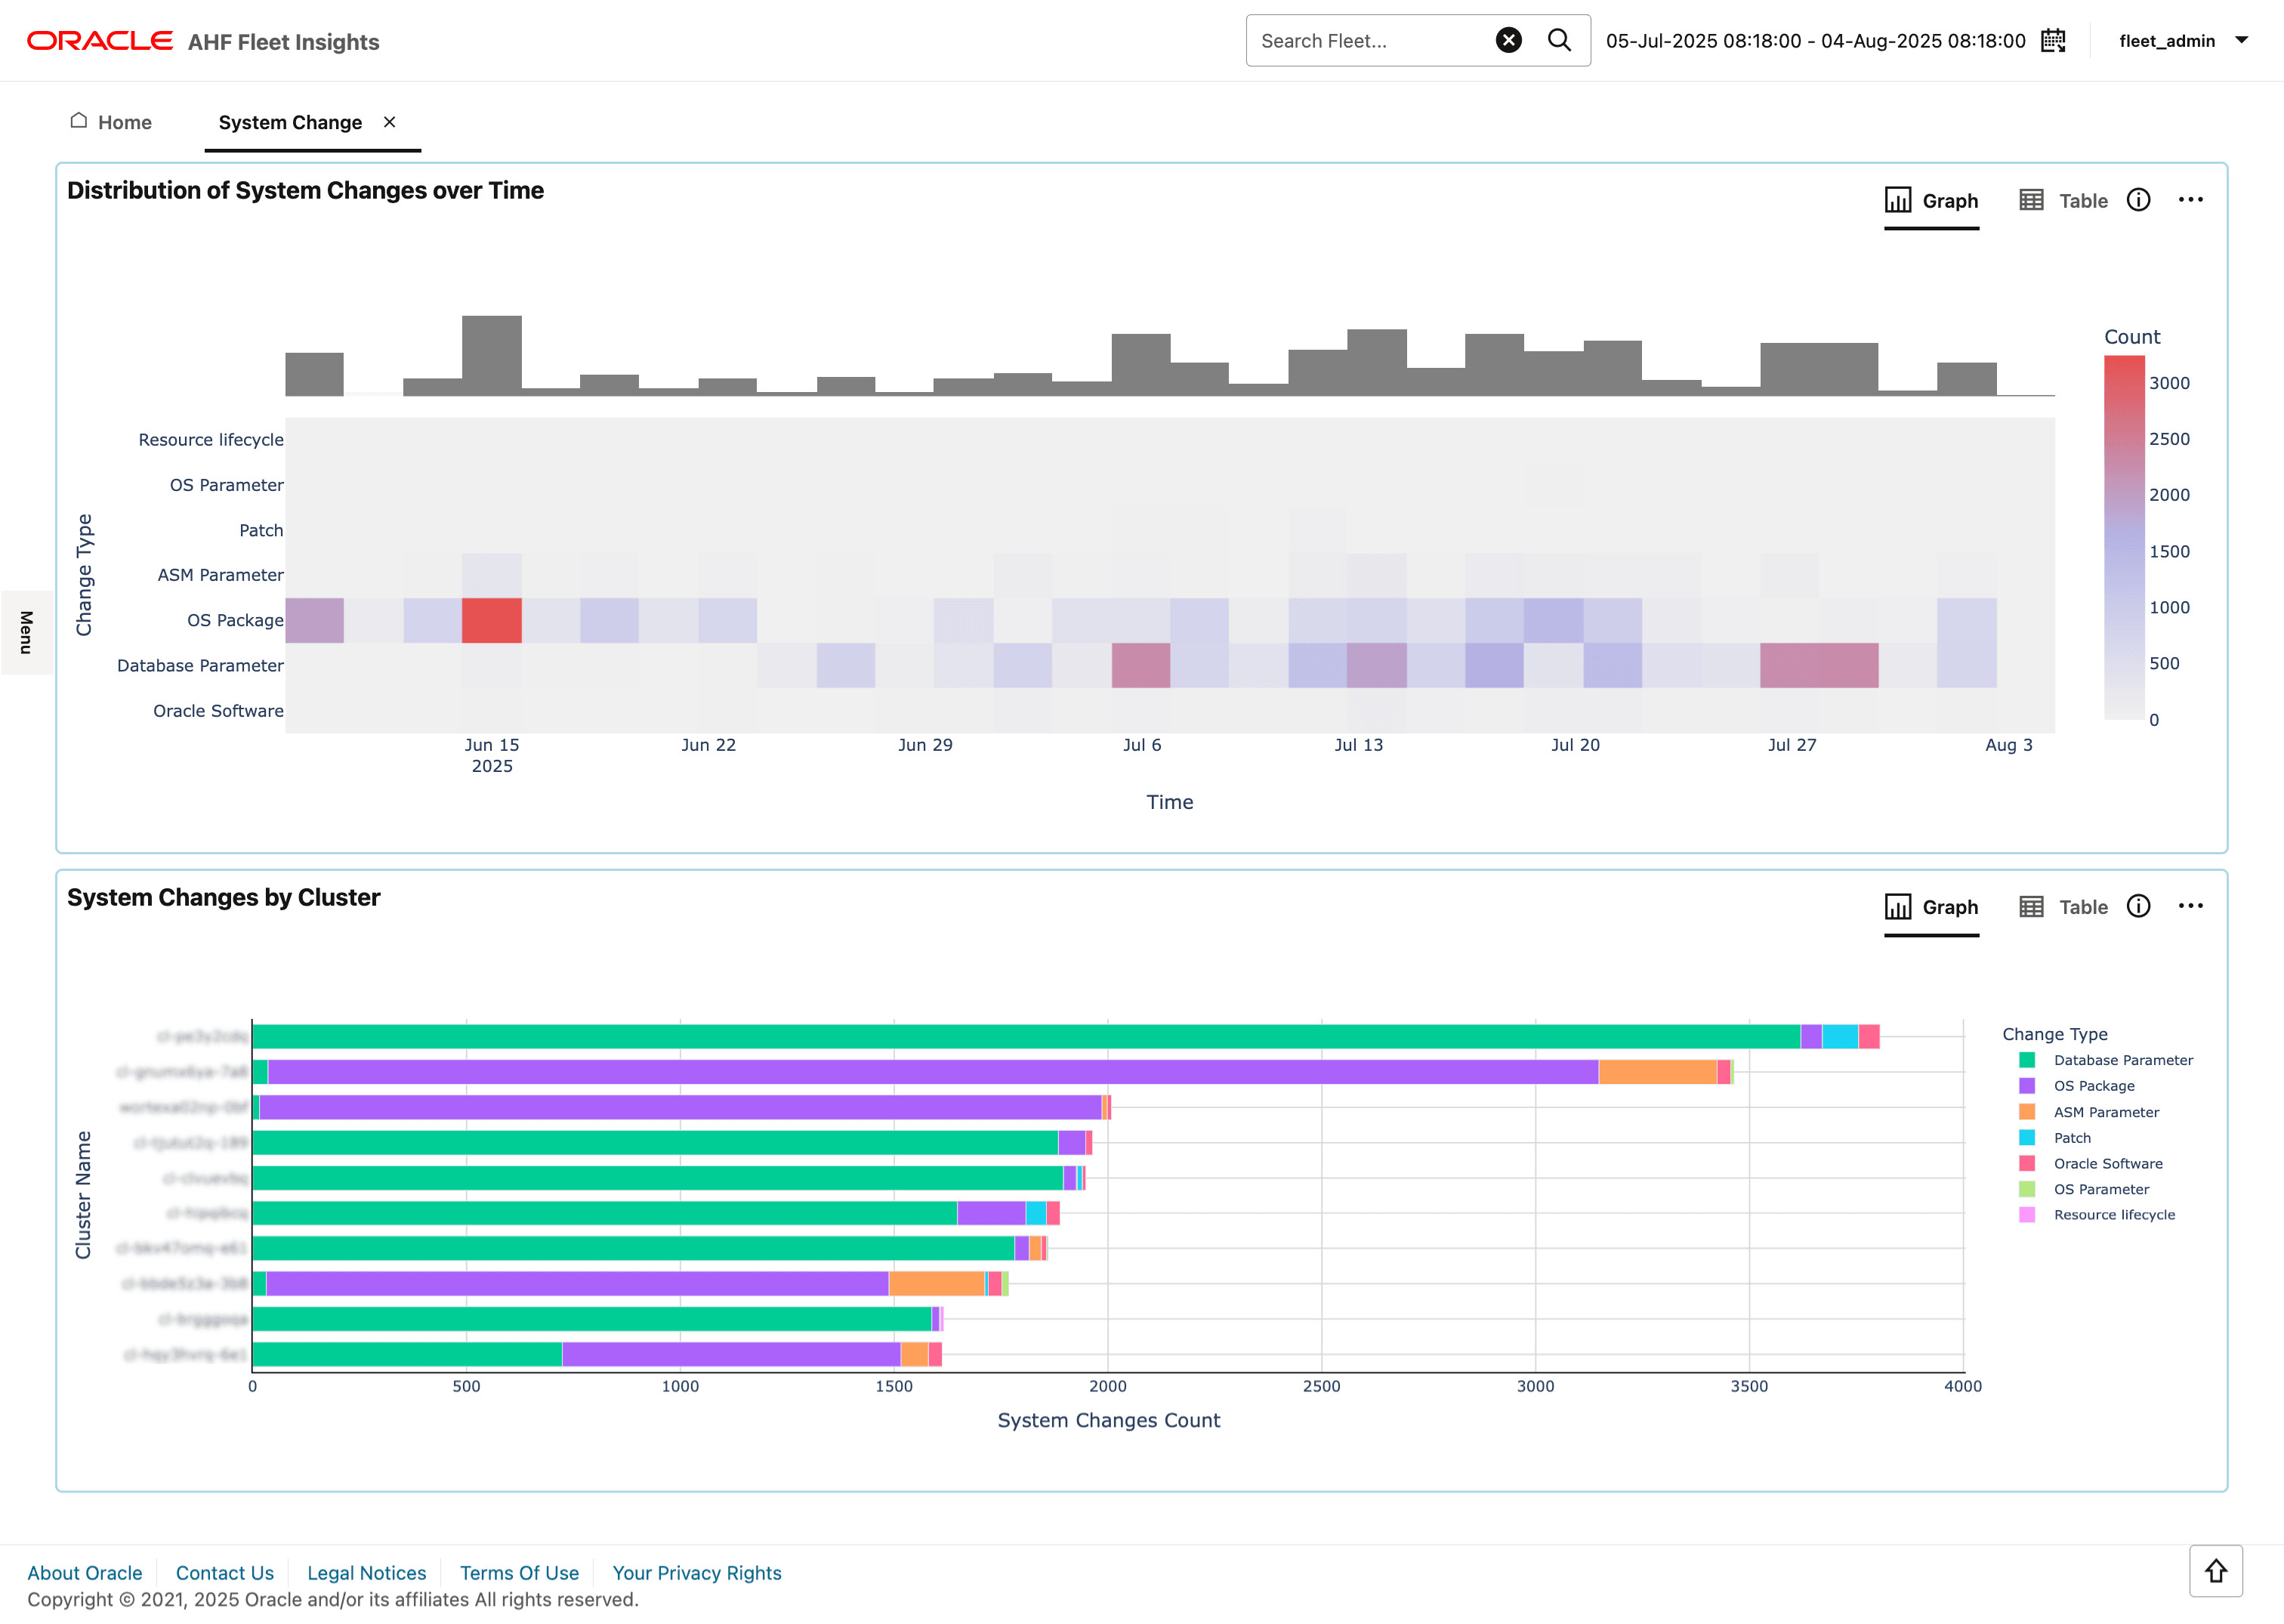
Figure 3-22 System Change

Distribution of system changes over time
- Y-axis: System change types (e.g., DB config, kernel parameters, file changes)
- X-axis: Time buckets within the selected range (e.g., hourly, daily)
- Margin Plot (above X-axis): Total number of changes per time bucket — useful for spotting change spikes or periods of unusual activity
This view highlights what types of changes occurred, when they occurred, and how frequently — ideal for trend analysis and change audits.
System changes by cluster
- X-axis: Clusters in the fleet
- Bars: Total number of changes
- Color breakdown: Specific system change types (e.g., OS-level, DB config, service restarts)
- View which clusters are undergoing frequent or large-scale changes
- Identify anomalies or outliers in change volume
- Select a cluster or system change type for drill-down investigation
- Monitor configuration drift across systems
- Detect risky or unauthorized changes in high-impact environments
- Align with change control and audit requirements
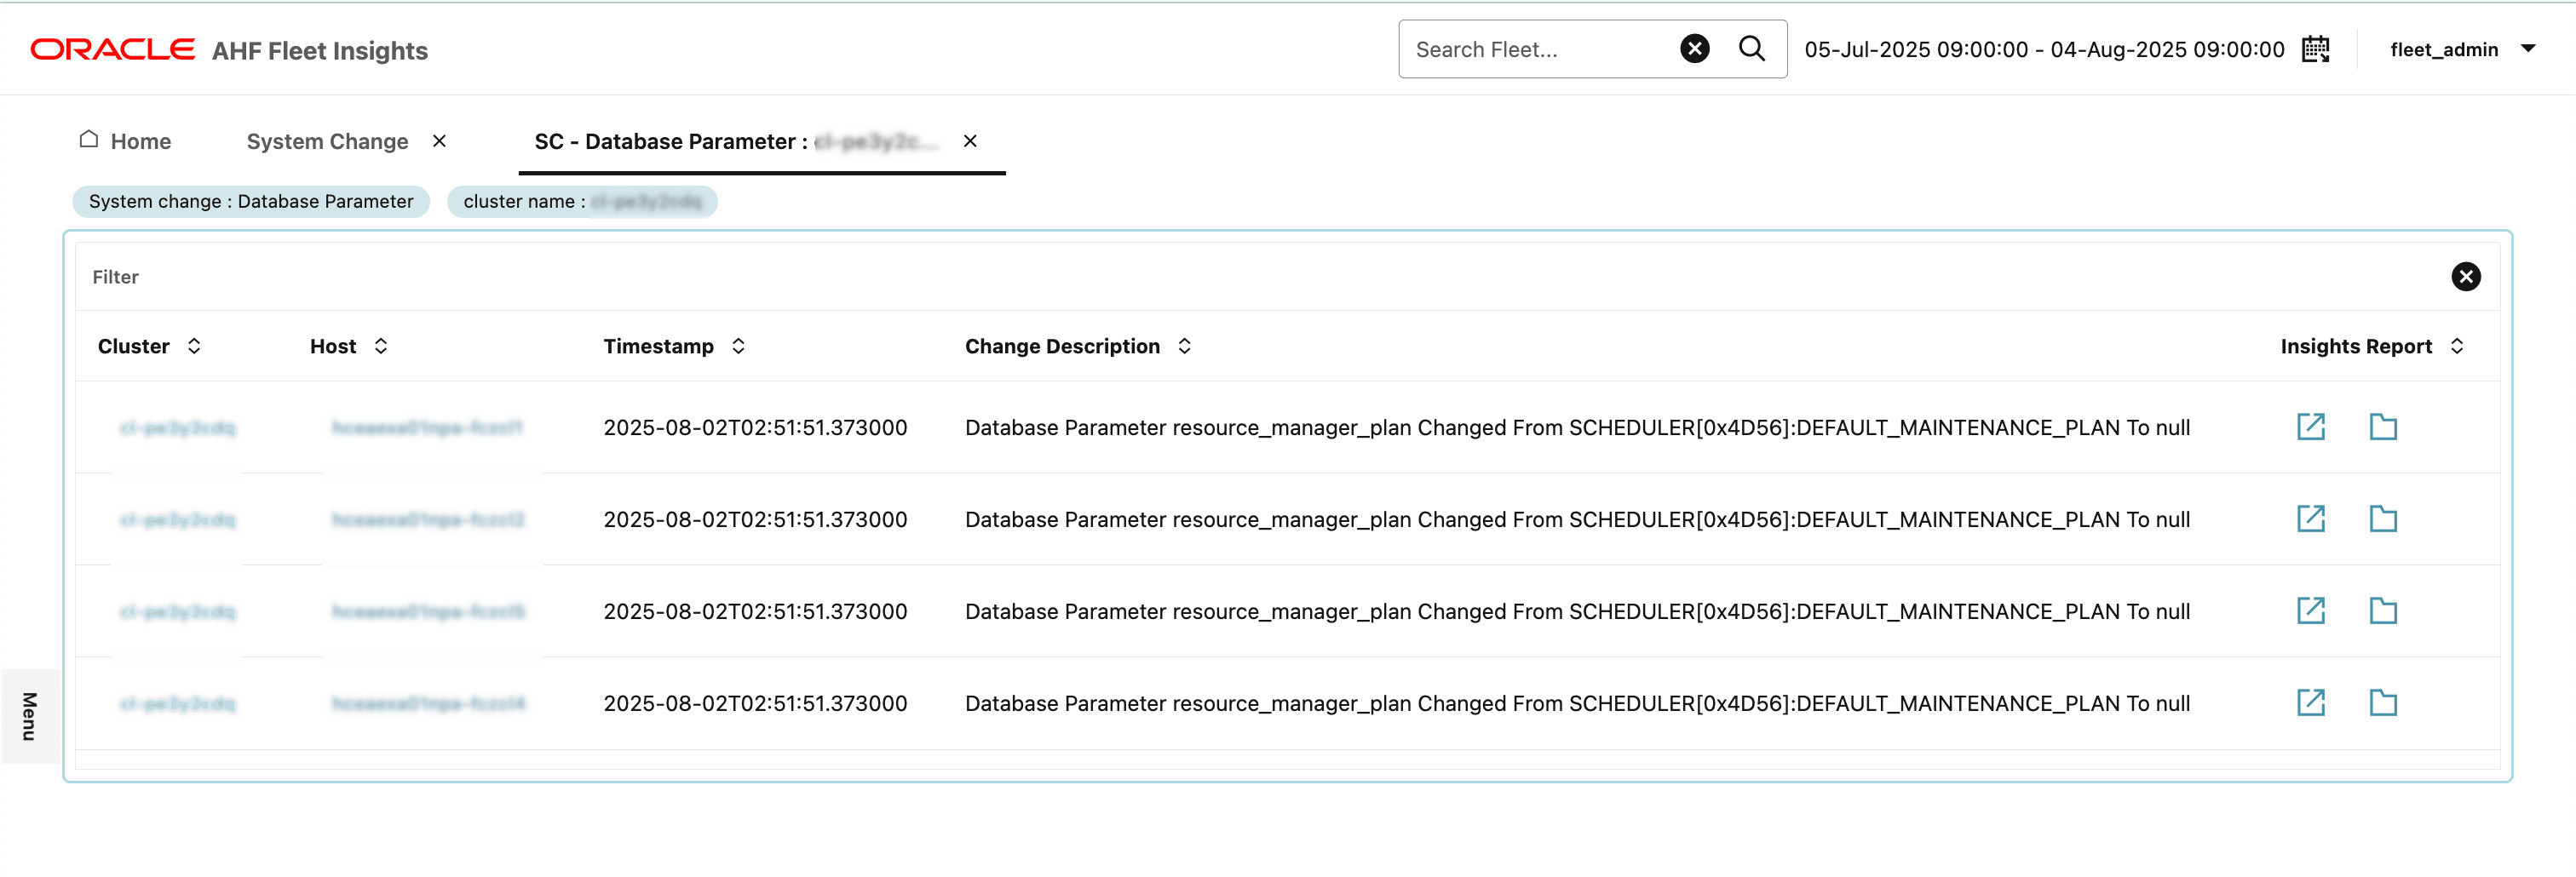
System Changes drill-down
Figure 3-23 System Changes

Purpose:
This drill-down page provides a detailed summary of all system changes that occurred based on the selected cluster name, system change type, or time range. From this view, you can navigate to the corresponding Insight report for a more granular analysis.
Parent topic: Insights