3.2.3.11 Space Analysis
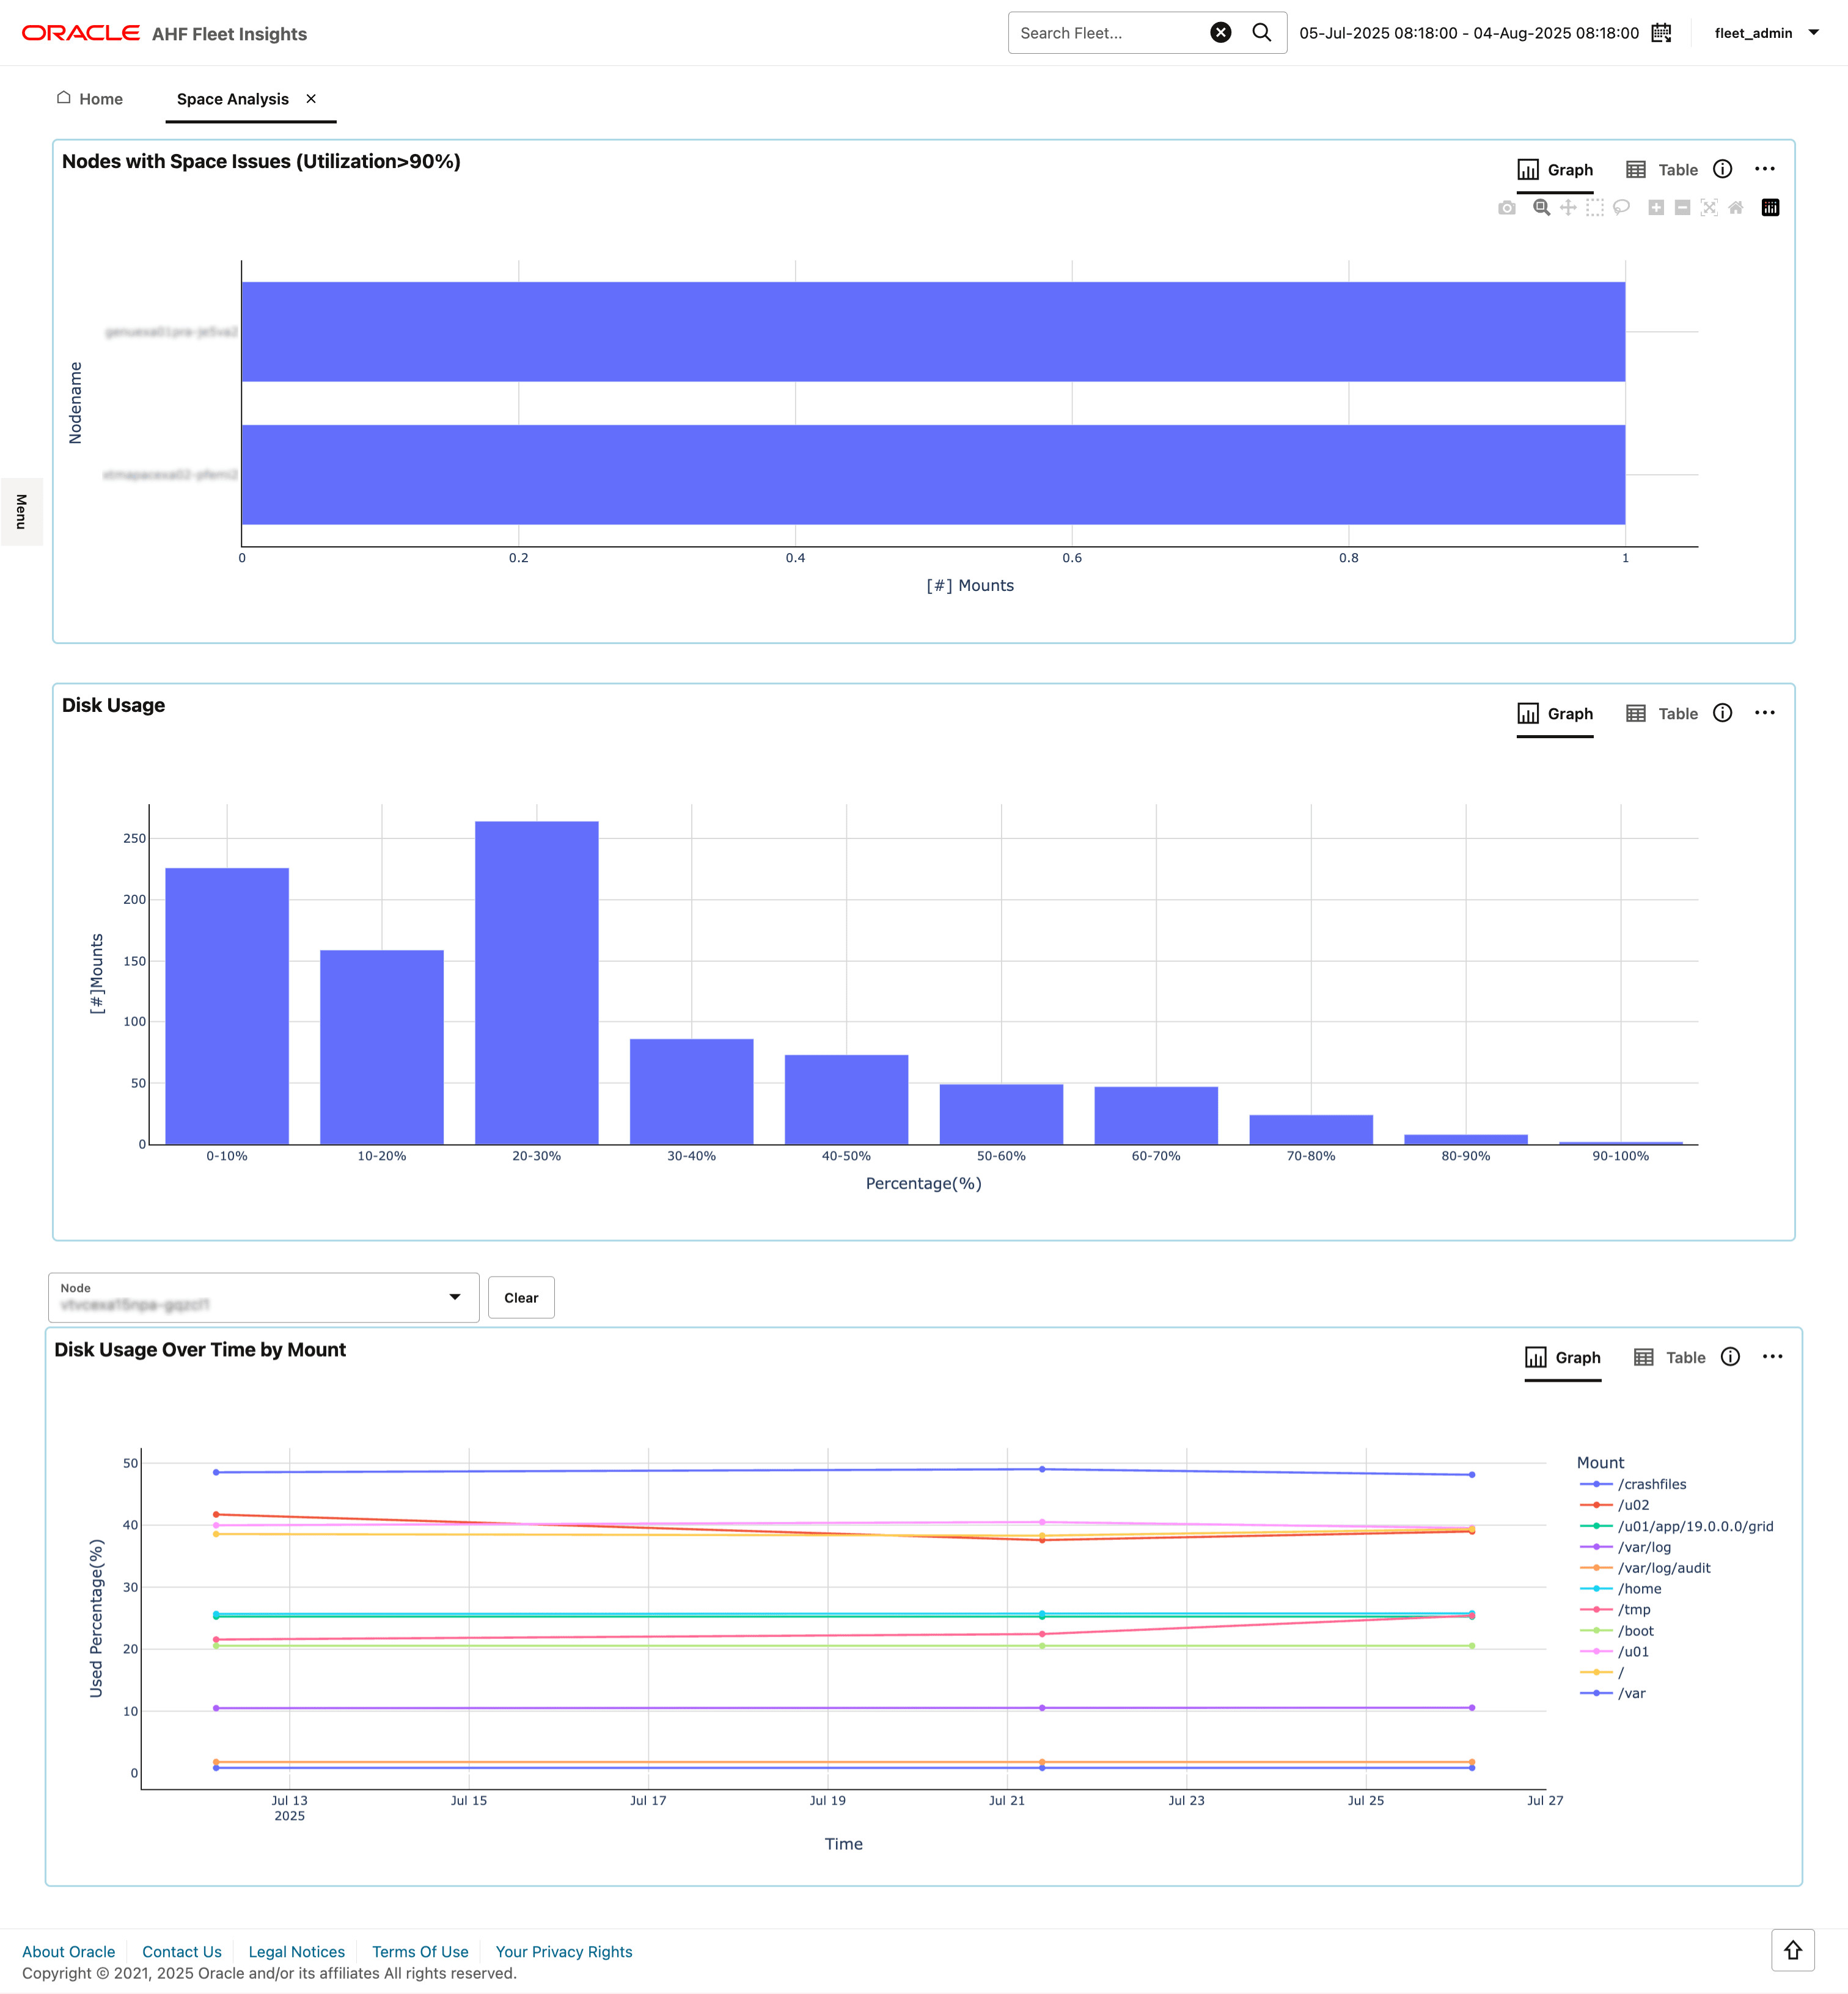
The Space Analysis dashboard provides a comprehensive overview of disk space utilization across all nodes in the fleet. It enables administrators to proactively detect storage-related issues, identify nodes approaching capacity, and manage disk usage efficiently.
Figure 3-27 Space Analysis

Nodes with space issues (utilization > 90%)
Note:
If this section displays "No data available", it means no nodes currently exceed the 90% utilization threshold — a positive indicator.- Each bar represents a node.
- Bar length corresponds to the number of problematic mounts on that node.
This visualization helps quickly identify which systems are at risk of running out of space.
Disk usage distribution
A vertical bar chart that shows how file system mounts are distributed across utilization ranges (e.g., 0–10%, 10–20%, etc.).
- Are most mounts underutilized?
- Is there a concerning cluster of high-usage mounts?
This view helps identify fleet-wide storage trends or imbalances.
Disk usage over time by mount
Note:
Select a node to view its historical disk usage.This time-series line chart tracks the percentage of disk usage over time for individual mount points on a selected node.
It enables long-term monitoring of storage growth and helps detect abnormal spikes or trends in disk consumption.
Node Drilldown: Space Analysis Details
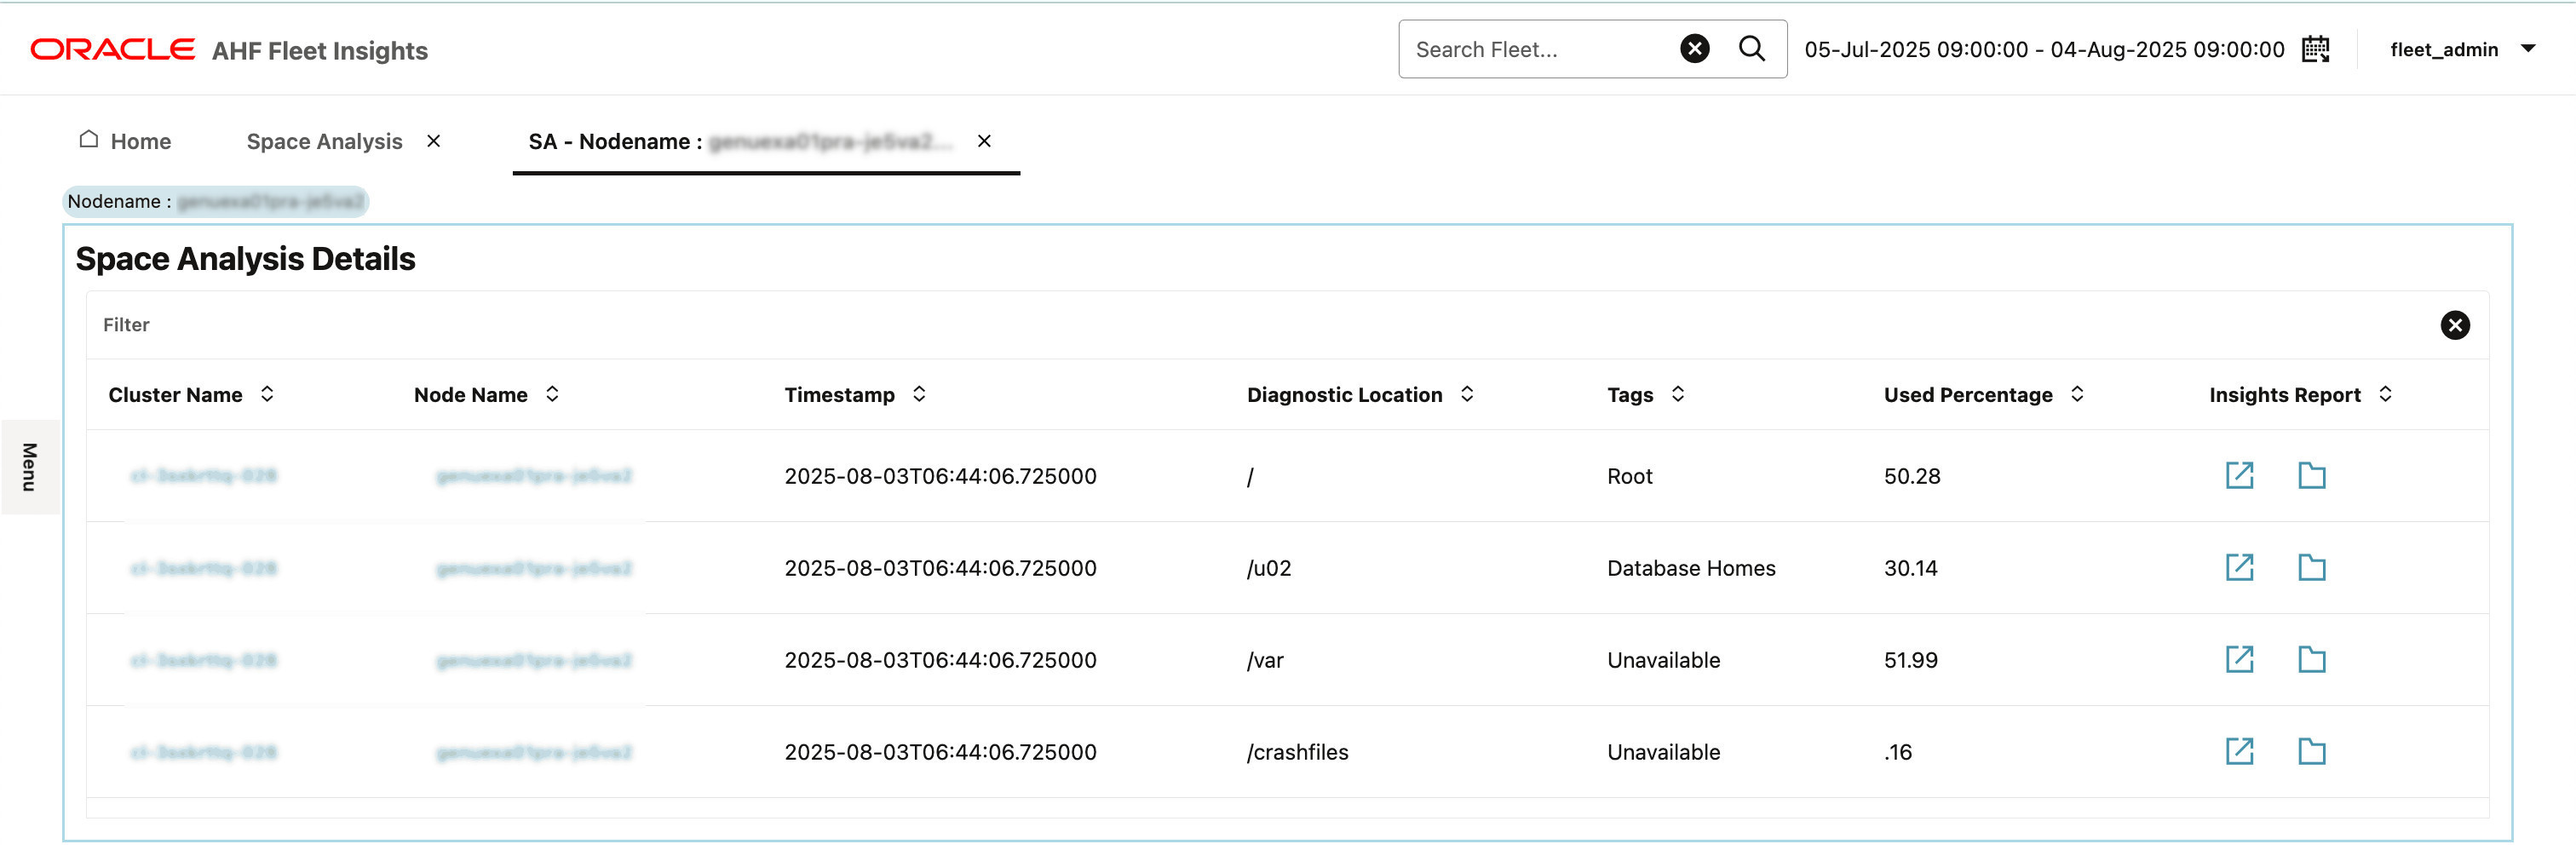
Clicking on a node in the Nodes with Space Issues chart opens the Space Analysis Details page for that specific node.
Figure 3-28 Space Analysis Details

Purpose:
This drilldown page offers a granular view of disk usage at the mount level for the selected node. It helps you analyze space utilization with precise location and timestamp details, enabling more accurate diagnostics.
Parent topic: Insights