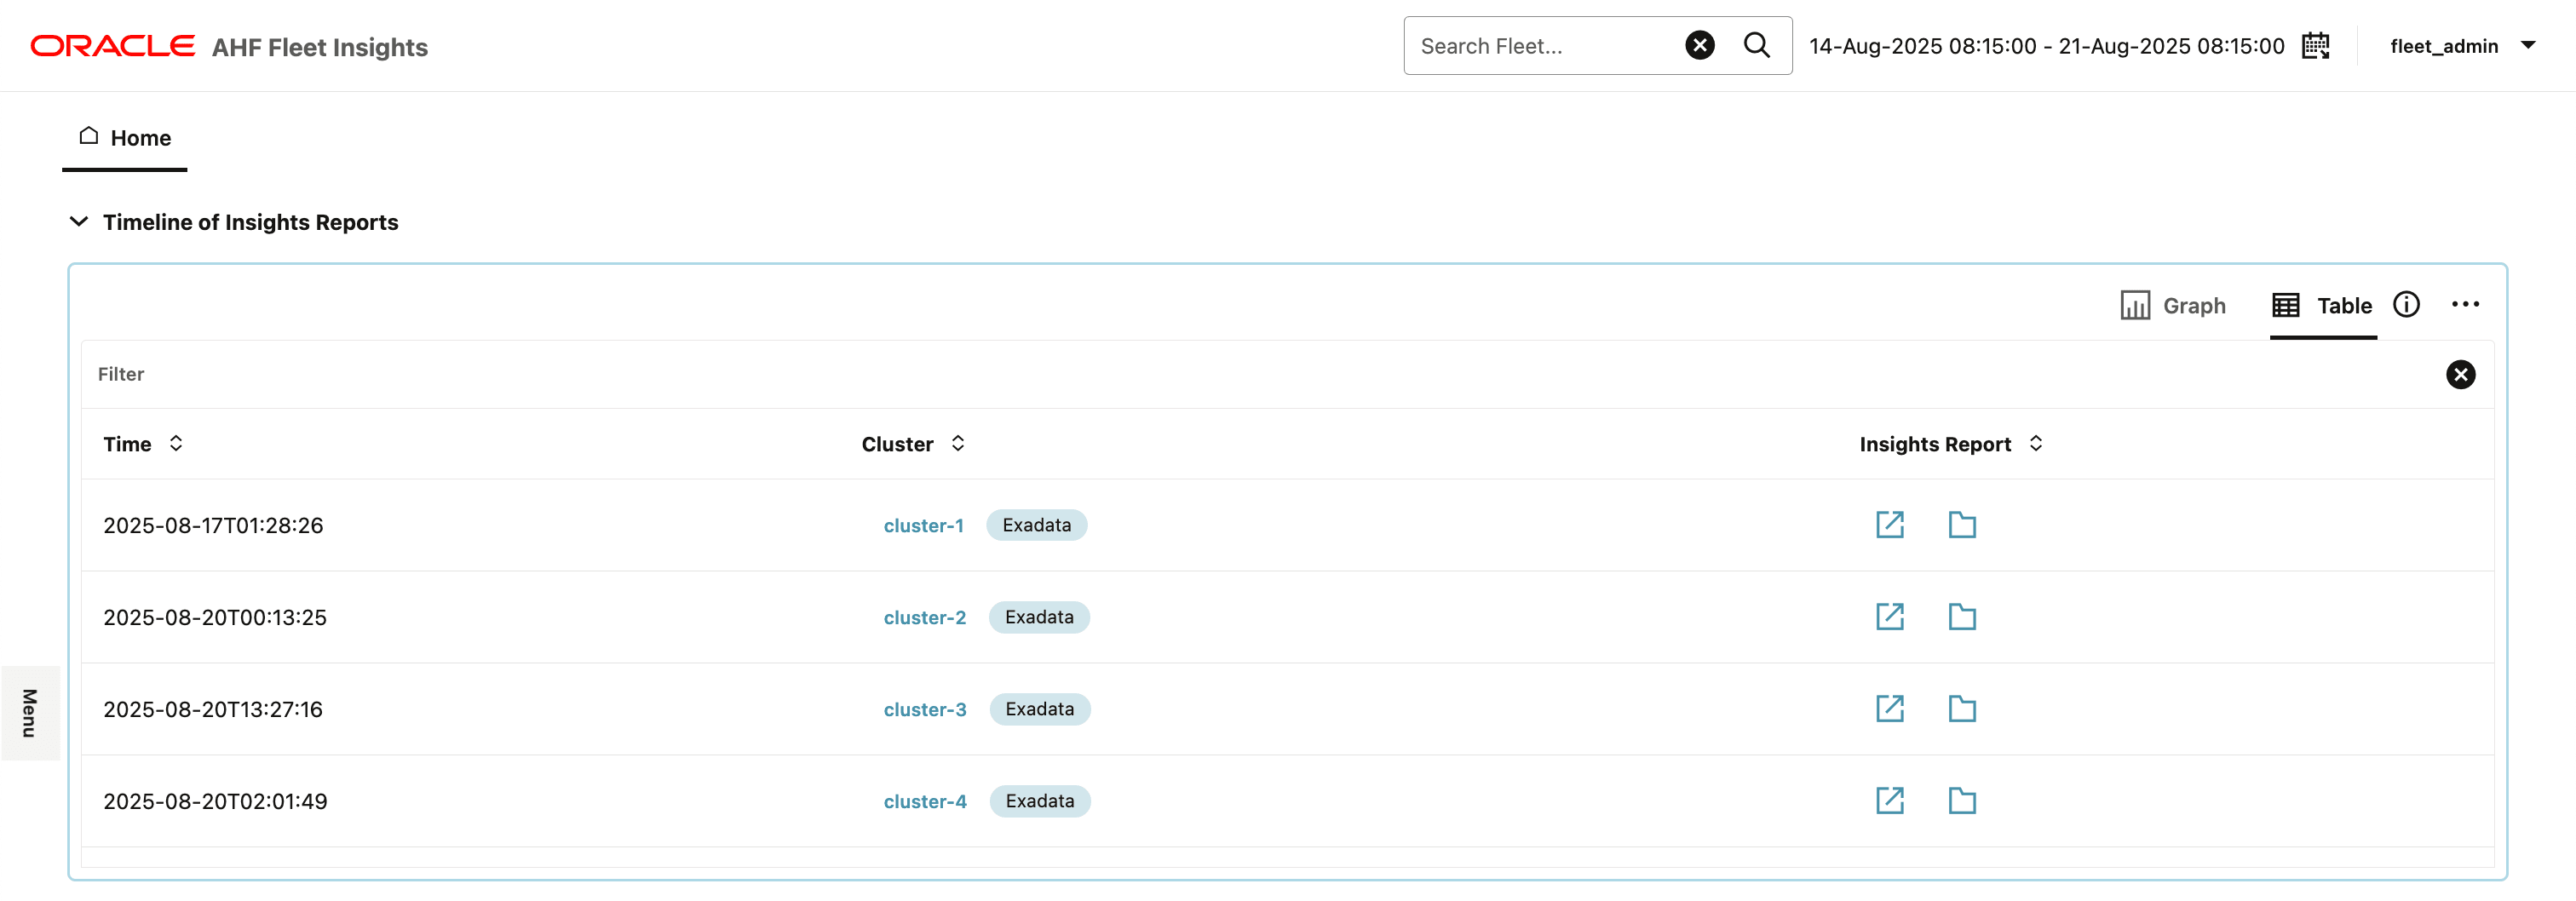
3.2.1.1 Keep track of all the Insights reports collected across the fleet
Maintain visibility into the collection and frequency of Insights reports across all clusters in your fleet.
Purpose:
- View Report Timelines: Monitor when reports are generated for individual clusters to understand activity patterns.
- Monitor Report Frequency: Track how often each cluster generates Insights reports to assess system behavior.
- Identify Report Bursts: Detect sudden spikes in report generation, which may point to recurring or urgent issues.
- Analyze Noise Levels: Spot clusters producing excessive or frequent reports, helping identify noisy systems or misconfigurations.
The plot displays the insights reports uploaded from monitored clusters over the selected time period.


Figure 3-2 Timeline of Events - Graph

Click a scatter point to access the corresponding insights report
Figure 3-3 Timeline of Events - Table

- Click the name of the cluster to view cluster summary and collection details.
- Click the file viewer to view files in a collection.
Parent topic: Home