3.1 Get Started with AHF Fleet Insights Web Interface
AHF Fleet Insights web interface is an intuitive and user-friendly interface making it accessible for both technical and non-technical users.
Log in to the application
- To fetch the application URL, go to the install location, and then run:
./ahffi info - Open the URL in a recommended browser.
- Enter the fleet admin credentials in the login screen, and then click Login.
Note:
- Default login credentials:
fleet_admin/welcome1 - During your first login, you will be prompted to update your password.
Note:
If you’re unable to view data on the dashboard after successful registration, it may be because, for AHF Fleet Insights (AHFFI), AHF collections are scheduled to run every 5th and 17th hour of the day. The corresponding cluster data will only appear in the Fleet Insights dashboard after the scheduled collection has been completed.Alternatively, you can trigger an on-demand collection immediately using thetfactl diagcollectcommand with the-insightsoption on the AHF client. For example:tfactl diagcollect -insights -last 4h - Default login credentials:
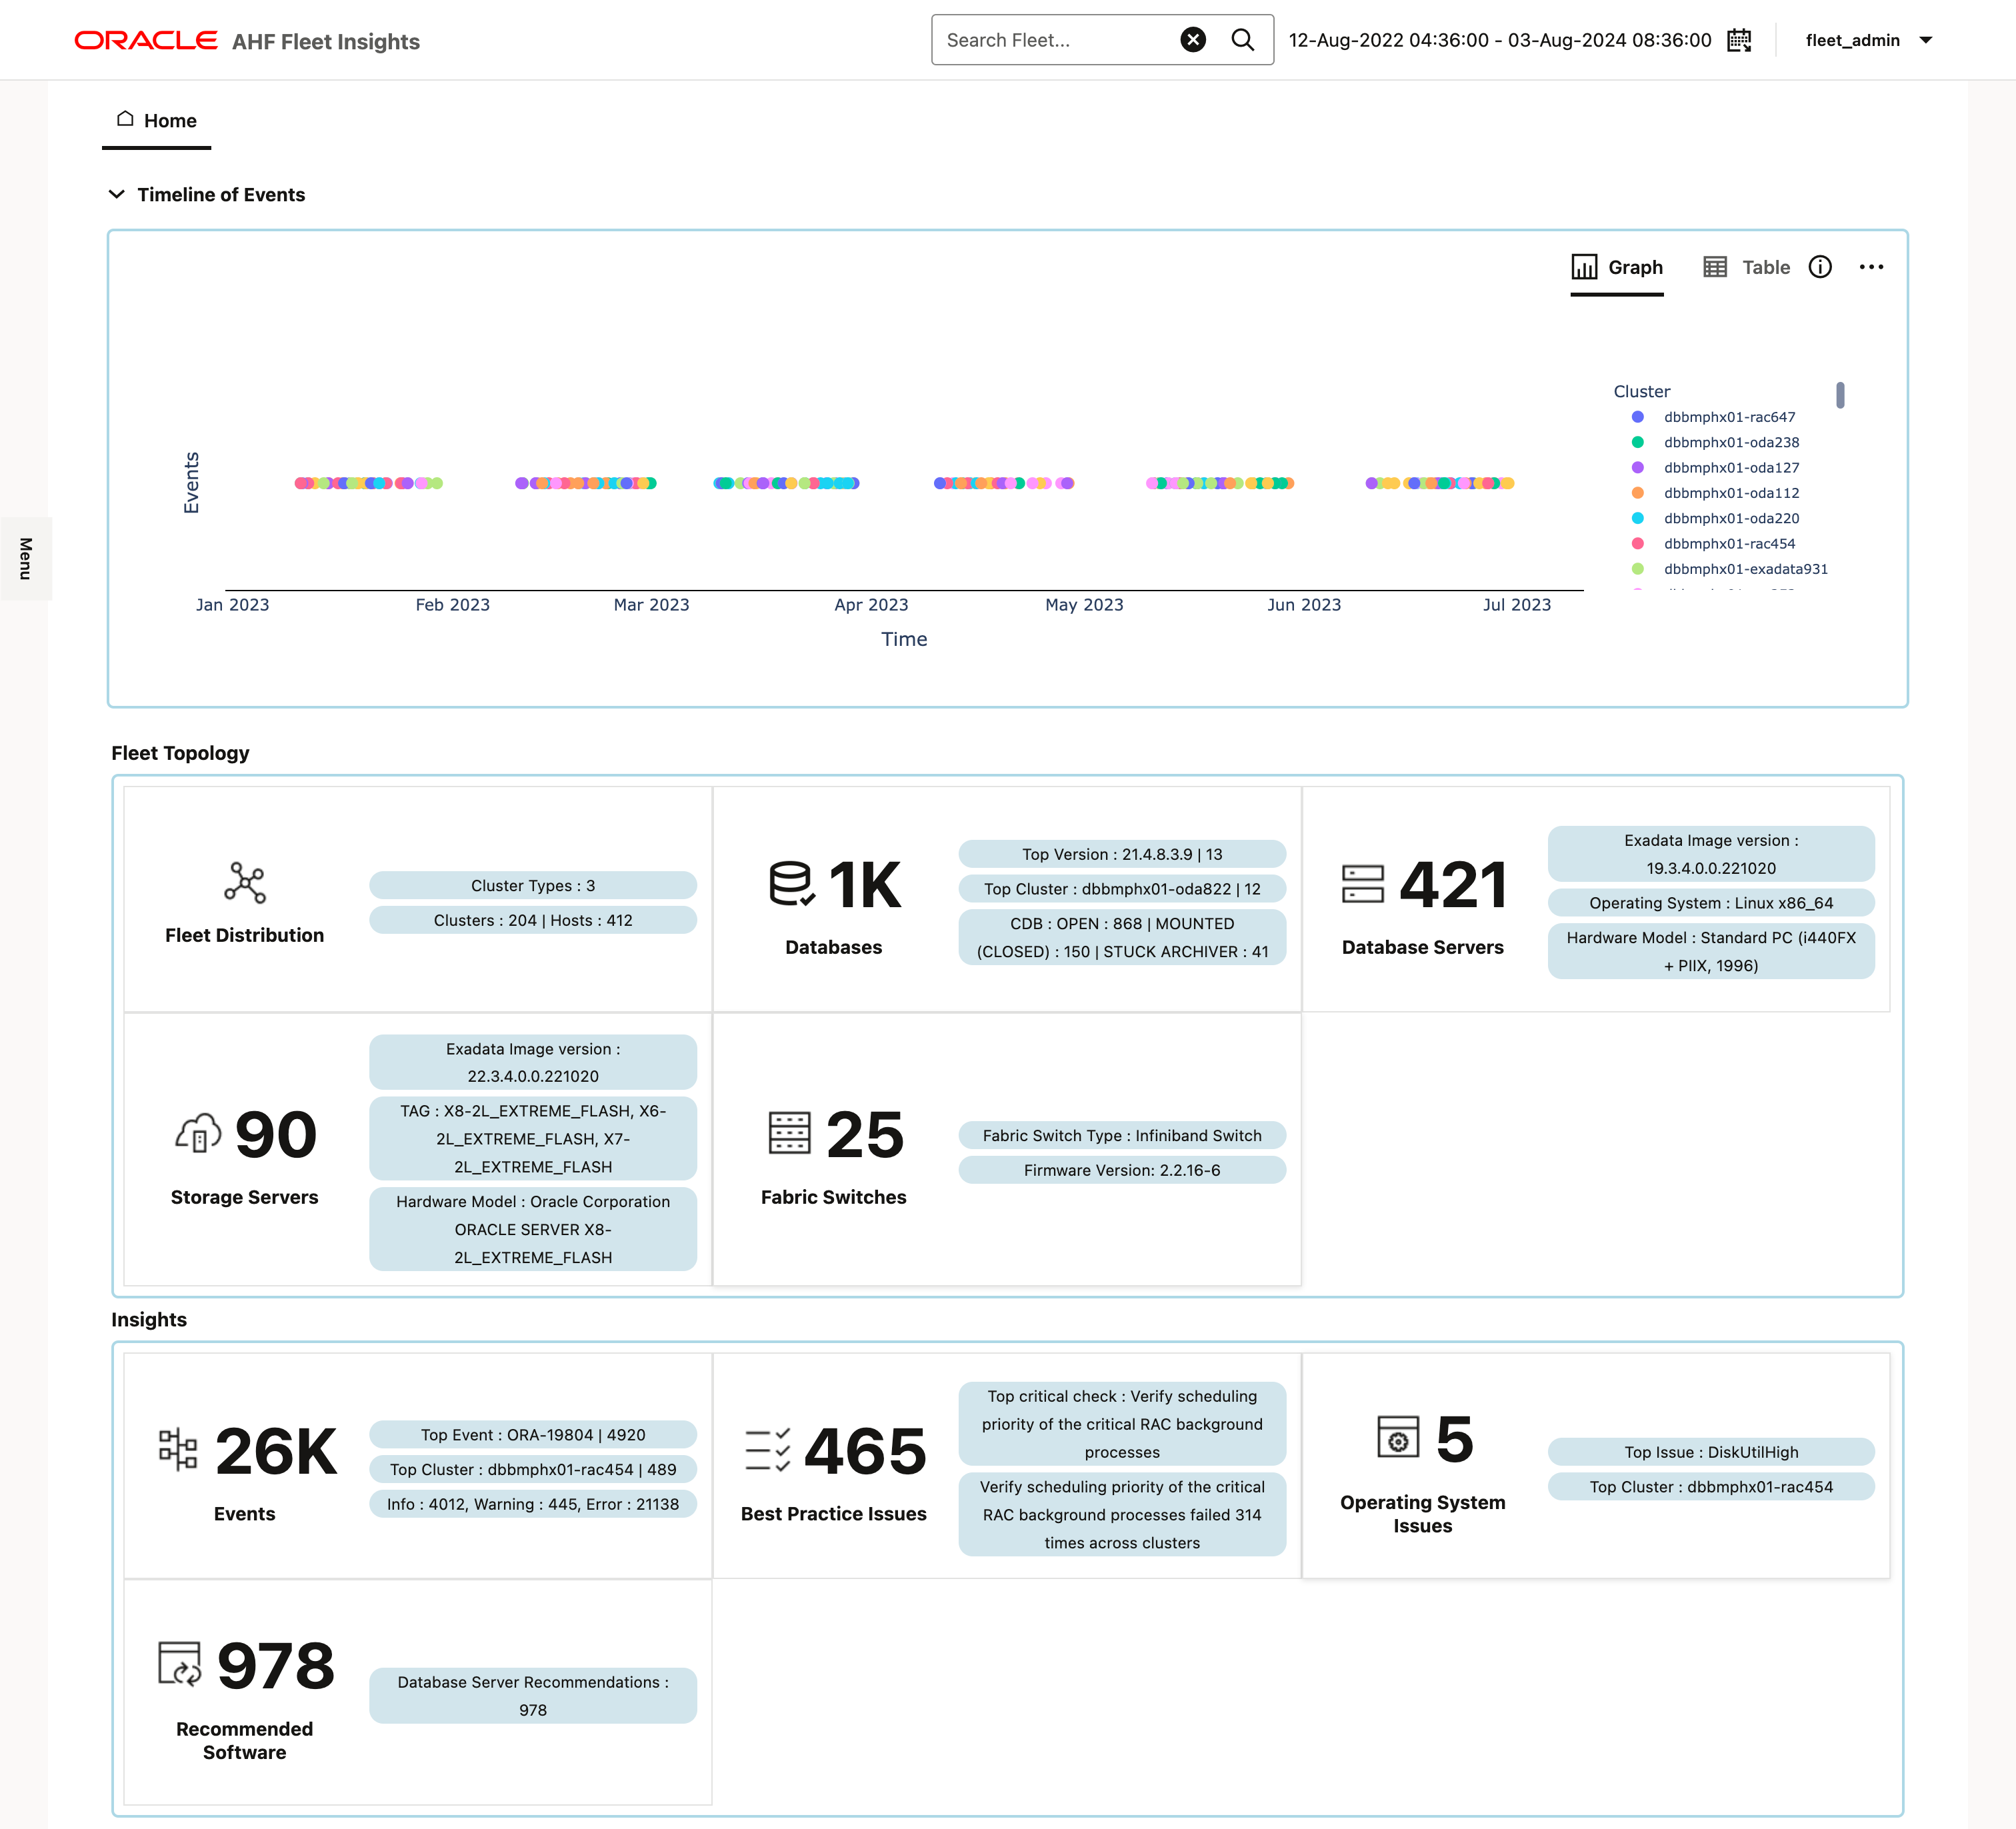
Figure 3-1 AHF Fleet Insights - Home

Home
- Global search and filter: Search and filter issues by specific cluster or system across the fleet.
- Global time filter: Filter issues that occurred within a specific time window.
- Menu drawer: Navigate between different sections of the dashboard.
- Timeline of events: A chronological view of Insights reports collected across the fleet.
- Fleet topology: Statistics for the complete fleet.
The fleet configuration displayed reflects the current state, regardless of the selected start time.
- Fleet Distribution: Aggregated statistics for the entire fleet.
- Databases: Aggregated metrics and insights about all Oracle Databases deployed across the fleet.
- Database Servers: Provides aggregated information about database servers across the fleet.
- Storage Servers: Provides aggregated information about storage servers across the fleet.
- Fabric Switches: Provides aggregated information about Network Fabric Switches across the fleet.
- Insights: Events occurred, Best Practice issues, operating system issues, and software recommendations.
- Detected Problems: Provides detected issues across systems, with insights into causes and resolution.
- Events: Provides details about the events that occurred across the fleet.
- Fleetwide Capacity Analysis: Quickly view resource usage across your fleet to spot top/bottom consumers, bottlenecks, and under utilized nodes for better performance.
- Cluster-Wise Usage Trends & Forecast: Track cluster-level usage trends, forecasts, and history to plan capacity and optimize resource allocation.
- Operating System Issues: Provides details about the metrics collected and a detailed report on operating system anomalies.
- Best Practice Issues: Provides the results of Best Practices Compliance checks across the fleet.
- System Changes: Helps to track system-level changes across the fleet.
- Recommended Software: Lists recommended software-supported versions.
- RPM List: Lists installed RPMs and compare clusters for differences in software packages.
- Patch Information: Provides recommended patches and highlighting systems running outdated database versions.
- Space Analysis: Helps to monitor space utilization across the fleet and identify systems nearing capacity.
Parent topic: AHFFI Web Interface