6.3.4.1 Monitoring Exadata Smart Flash Log Using AWR
Following are descriptions and examples of the Flash Log Statistics sections in the AWR report. By reviewing these sections of the AWR report, administrators can understand the operation of Exadata Smart Flash Log.
Flash Log
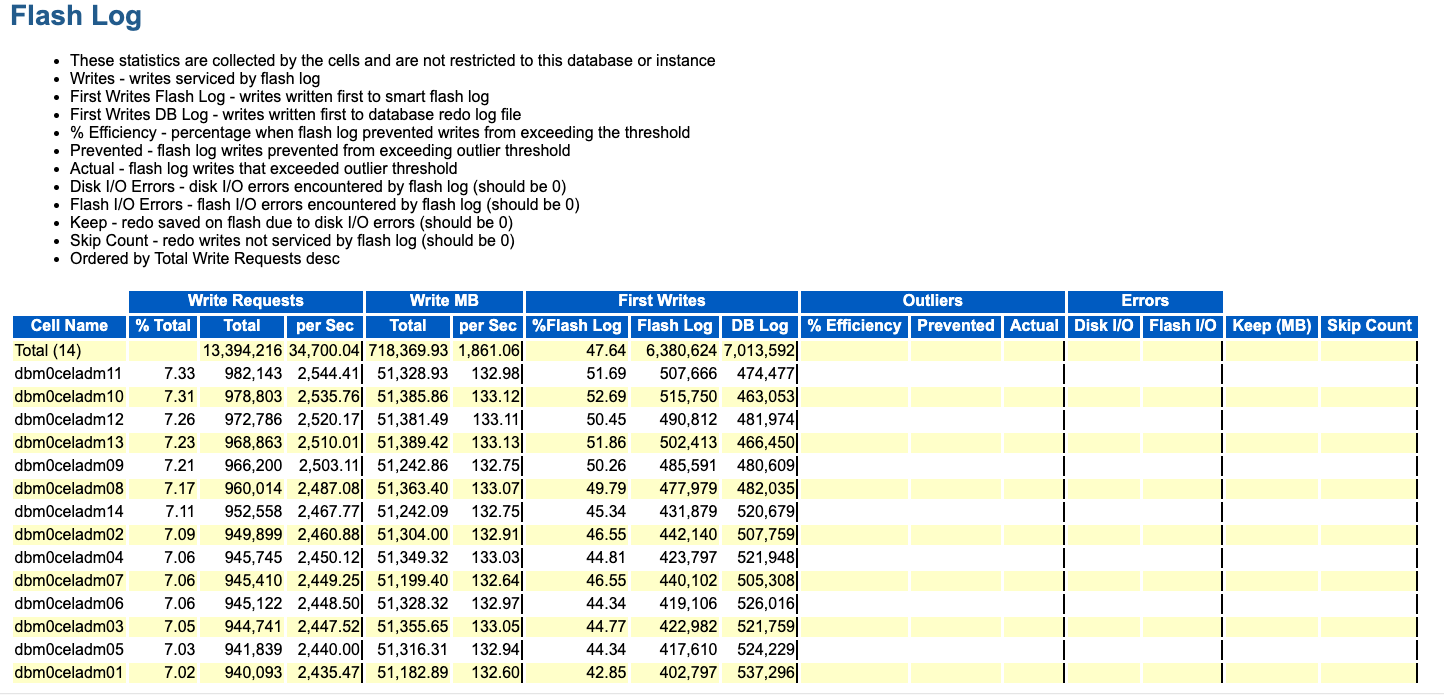
The Flash Log section contains summary statistics about the operation of Exadata Smart Flash Log, including the number and of writes to Exadata Smart Flash Log, the number outliers prevented by Exadata Smart Flash Log, and the number of times when Exadata Smart Flash Log is skipped.
The following show an example of the Flash Log section. As shown in the example, when Exadata Smart Flash Log operates optimally, I/O is evenly distributed across all of the cells and there are no skips.
Figure 6-20 AWR Report: Flash Log

If the Skip Count is greater than zero, then the Flash Log Skip Details section contains the reasons for skipping Exadata Smart Flash Log.
Redo Write Histogram
The Redo Write Histogram section provides histograms that show the
log file parallel write latency from the database, along with
the redo write request completion latency from the storage servers.
By comparing the database and cell latency histograms, you can determine if the high
latency outliers are related to processing bottlenecks on the storage servers.
Figure 6-21 AWR Report: Redo Write Histogram

Parent topic: Monitoring Exadata Smart Flash Log