1.14.1 About ExaWatcher Charts
ExaWatcher collects and presents performance data on the storage servers and database servers of Oracle Exadata for a specified period of time.
To extract the data collected by ExaWatcher, run
GetExaWatcherResults.sh and specify the start and end time of the
desired time range. The results are contained in a compressed archive file that may be
written to your specified directory location.
For example:
$ GetExaWatcherResults.sh --from 08/24/2023_17:00:00 --to 08/25/2023_17:00:00 --resultdir /var/log/oracle/ExaWatcherResultsNote:
You can also use the-c or
--scp options with GetExaWatcherResults.sh to copy
the resulting archive file to a different location.
GetExaWatcherResults.sh also generates HTML pages that contain
charts for IO, CPU utilization, cell server statistics, and alert history. The IO and
CPU utilization charts use data from iostat, CPU detail uses data from
mpstat, and cell server statistics use data from
cellsrvstat. Alert history will be retrieved for the specified time
frame.
You can find the new charts in the resulting archive file. In the archive file, there is a subdirectory named: Charts.ExaWatcher.<hostname>/<timestamp>_<duration>/, for example, Charts.ExaWatcher.xxxxceladm13.oracle.com/2016_08_24_17_00_00_01h00m00s_0.
To view the HTML pages, the archive file must be extracted on a machine with a local
browser and Internet access. Then, open
Charts.ExaWatcher.<hostname>/<timestamp>_<duration>/index.html
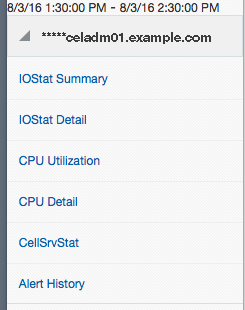
in a browser. The left panel on that page shows the following menu:
Figure 1-1 ExaWatcher Menu in the Left Panel

Description of "Figure 1-1 ExaWatcher Menu in the Left Panel"
Note:
For screen reader users, the menu items are navigated using the UP/DOWN arrow keys and activated using the SPACE bar. The TAB key will move you to the frame on the right side.The CellSrvStat menu item is available only when run against a storage server. The Alert History menu item is available only if there were alerts during the requested time frame.