About Performance Analyzer
The Performance Analyzer, available in the Console of the Essbase web interface, helps you monitor usage and performance statistics of your Essbase service.
Performance Analyzer reads log files behind the scenes, scanning them at intervals that you specify. From the log files it creates .csv files of Essbase activity data. The data comes from the application ODL log, agent log, and WebLogic logs.
After a Performance Analyzer file grows to 10 MB, a new file is created. By default, Essbase keeps a total of 112 files, at which point Essbase deletes the oldest file first. The most recent file is called EssbaseHpa_Data.csv. The older files are named numerically; for example, EssbaseHpa_n_Data.csv.
A template in the Essbase file catalog, in Files > gallery > System Performance > Health and Performance Analyzer, can help you learn more about Performance Analyzer. To use the gallery template, you copy and paste CSV data into the template.
- combine .csv files or file portions to create performance analysis for precise time intervals.
- build charts or other visualizations of the data.
Enable Performance Analyzer and Choose Settings
If you are a Service Administrator, you can enable the Performance Analyzer in the Console of the Essbase web interface to capture information from log files about usage and performance.
- In the Essbase web interface, on the Home page, click Console.
- Click Performance Analyzer.
- Click Settings.
- In the Settings dialog box, use the toggle switch to enable Performance Analyzer.
- In the Interval field, choose the interval at which you want new .csv files to be created. The value can be between 2 and 100 minutes.
- In the Max files count field, choose the maximum number of .csv files you want Essbase to retain. The value can be between 1 and 1000 files.
Understand and Work With Performance Analyzer Data
Performance Analyzer generates CSV data based on logs and organizes it into columns. First, you gather the CSV data and open the .csv files in Excel, and then you can examine and work with the data using Excel filtering tools.
- Locate the .csv files you want to analyze.
- In the Essbase web interface, on the Home page, click Console.
- Select Performance Analyzer.
- Find the .csv file or files matching the time period you are interested in.
- Download the files:
- Select the download icon under Actions to download each file.
- Repeat for additional files you want to download.
Open the files in Excel and examine the columns at the top of the files. Most of the columns are self-explanatory. They contain data helpful for filtering performance analysis, such as application and cube name, time stamp, and date.
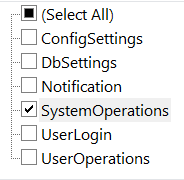
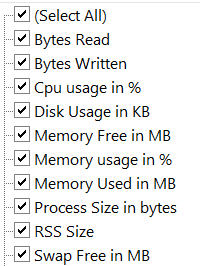
Columns N and O need further discussion, as they contain key information. Column N contains information such as configuration settings, database settings, and user logins. Column O contains specific entries within those categories. In Excel, you can filter on column N and choose a category, and then filter on column O to choose specific entries within those categories.
- UserLogin shows how long the user was active, and when the user logged out.
- UserOperation shows all user operations, such as data loads, calculations, and restructures. It also shows errors and exceptions.
- SystemOperation shows CPU, memory, disk, and I/O usage.
- DBSettings shows database statistics.
- ConfigurationSetting shows configuration settings.
- Notification identifies when there is a severe error.
If you filter on column N and then choose the specific category you are interested in, you can then view events within that category by filtering on column O.
Example view of a filter on column N:
Example view of a filter on column O: