Multidimensional Calculation Concepts
An Essbase database is conceptualized as a cube, because it has multiple dimensions. Each data value is an intersection that includes every dimension, so it is "multidimensional." A slice is a selection of data values and is also multidimensional.
Consider an outline for a simplified Essbase database, which has three dimensions—Accounts, Time, and Scenario.
Figure 16-3 Calculating a Multidimensional Database
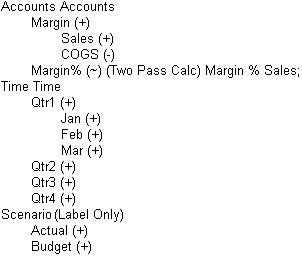
The Accounts dimension has four members.
-
Sales and COGS are input values.
-
Margin = Sales - COGS.
-
Margin% = Margin % Sales (Margin as a percentage of Sales).
The Time dimension has four quarters. The members in Qtr1 are Jan, Feb, and Mar, the members in Qtr2 are Apr, May, Jun, and so on.
The Scenario dimension has two child members—"Budget" for budgeted financial values, and "Actual" for real financial values.
The three-dimensional outline can be compared to a three-dimensional cube.
Figure 16-4 Illustration of a Three-Dimensional Database
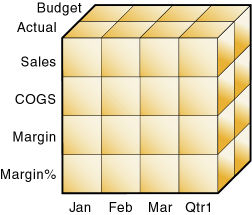
An intersection of members (one member on each dimension) represents a data value; a data value is stored in one cell in the database. To refer to a specific data value in a multidimensional database, you must specify each member on each dimension.
In Essbase, member combinations are denoted by a cross-dimensional operator (->). Create the cross-dimensional operator using a hyphen (-) and a greater-than symbol (>). Do not include a space between the cross-dimensional operator and members.
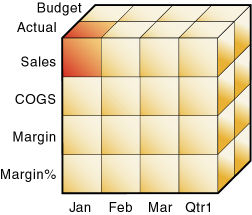
The single cell containing the data value for Sales, Jan, Actual is written as Sales -> Jan -> Actual.
Figure 16-5 Sales, Jan, Actual Slice of the Database
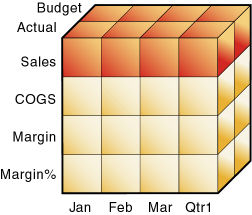
When you refer to Sales, you are referring to a slice of the database containing eight values:
-
Sales -> Jan -> Actual
-
Sales -> Feb -> Actual
-
Sales -> Mar -> Actual
-
Sales -> Qtr1 -> Actual
-
Sales -> Jan -> Budget
-
Sales -> Feb -> Budget
-
Sales -> Mar -> Budget
-
Sales -> Qtr1 -> Budget
Figure 16-6 Sales, Actual, Budget Slice of the Database
When you refer to Actual Sales, you are referring to four values:
-
Sales -> Jan -> Actual
-
Sales -> Feb -> Actual
-
Sales -> Mar -> Actual
-
Sales -> Qtr1 -> Actual
Figure 16-7 Actual, Sales Slice of the Database
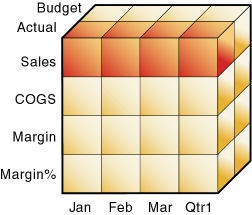
When Essbase calculates the formula "Margin% = Margin % Sales," it takes each Margin value and calculates it as a percentage of its corresponding Sales value.
Essbase cycles through the database and calculates Margin% as follows:
-
Margin -> Jan -> Actual as a percentage of Sales -> Jan -> Actual.
The result is placed in Margin% -> Jan -> Actual.
-
Margin -> Feb -> Actual as a percentage of Sales -> Feb -> Actual.
The result is placed in Margin% -> Feb -> Actual.
-
Margin -> Mar -> Actual as a percentage of Sales -> Mar -> Actual.
The result is placed in Margin% -> Mar -> Actual.
-
Margin -> Qtr1 -> Actual as a percentage of Sales -> Qtr1 -> Actual.
The result is placed in Margin% -> Qtr1 -> Actual.
-
Margin -> Jan -> Budget as a percentage of Sales -> Jan -> Budget.
The result is placed in Margin% -> Jan -> Budget.
-
Essbase continues cycling through the database until it has calculated Margin% for every combination of members in the database.
Refer to Block Storage Database Calculation Order.