13 The Instance Viewer Page
Note:
Available only if you signed in as a database user with DBA and PDB_DBA roles.To navigate to the Instance Viewer page, do either of the following:
-
In the Launchpad page, click Instance Viewer.
-
Click Selector
 to display the navigation menu. Under Monitoring, select
Instance Viewer.
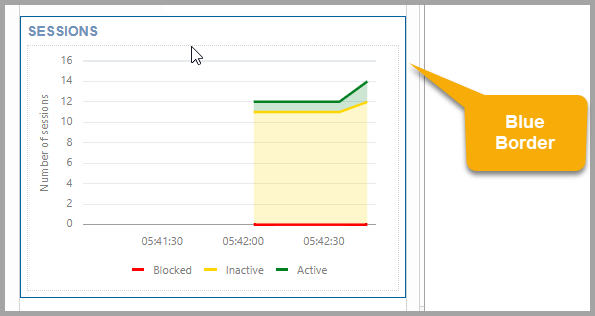
When hovering over a chart, a dark blue border indicates that you can click to drill down to the relevant page for more detailed information.
Figure 13-1 Dark Blue Border to Drill Down

Description of "Figure 13-1 Dark Blue Border to Drill Down"
The types of information displayed include:
-
Database
-
Clients
-
Sessions
-
Processes (Counts, Execution Rate, Parse Rate, Open Cursors, Commit Rate)
-
Waits
-
Memory (DB Block Rate, Logical Reads, Allocation, Redo Generation)
-
Storage (Files, Redo Log)
-
DB CPU Ratio (database operations as a percentage of CPU activity)
-
Top SQL (provides performance metrics on SQL operations, which are sorted based on the CPU time required)