3.9 Using Real Time SQL Monitor
The Real Time SQL Monitor feature provides a dashboard interface for real-time monitoring of SQL query execution. Users can view long-running and parallel SQL statements, and relevant performance metrics in a single, centralized location.
SQL monitoring is automatically started when:
- a SQL statement runs parallel.
- a SQL statement has consumed at least 5 seconds of CPU or I/O time in a single execution.
- the /*+ MONITOR +*/ hint is used in the execution of a SQL statement.
Prerequisites
Real Time SQL Monitor requires:
-
the Oracle Database Tuning Pack.
-
the Database Administrator role. You do not require any special database privileges to use this feature to monitor SQL for schema objects that you own. However, to view all monitored SQL in the database, you need the
SELECT_CATALOG_ROLE.
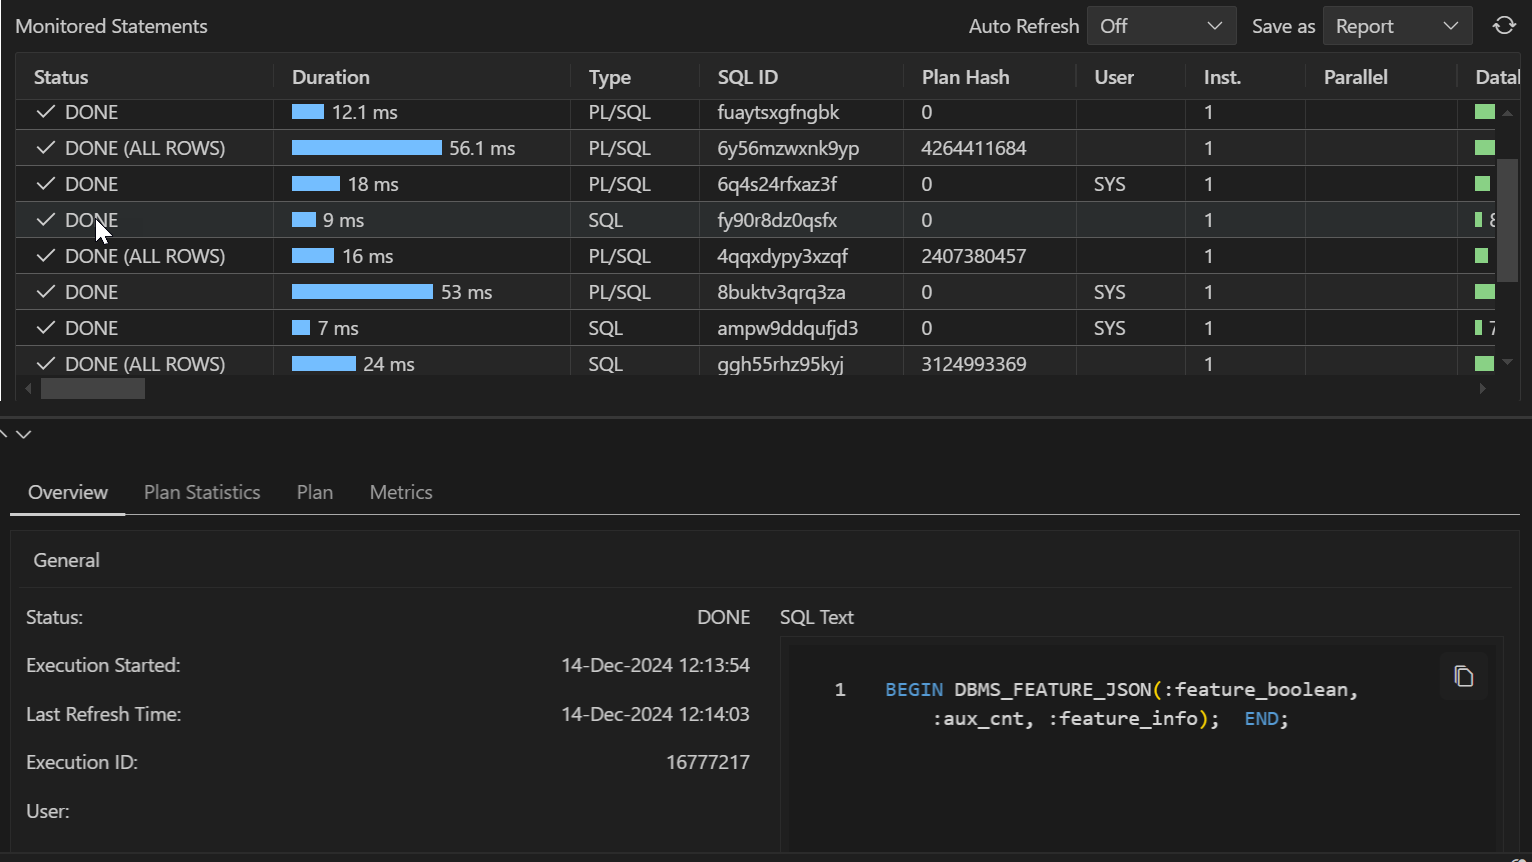
The Real Time SQL Monitor view consists of a table where each row displays information about a query that is currently executing or has completed executing for a selected database connection.

The Monitored Statement table includes the following information:
- Status: Current state of the SQL statement execution. For example, a SQL
statement that has finished execution shows a
DONEstatus. - Duration: The amount of time taken to execute the statement or the amount of time spent waiting before which the statement is executed.
- Type: Type of statement (SQL or PL/SQL).
- SQL ID: SQL identifier of the monitored statement.
- User: Name of user that executes the statement.
- Parallel: This column shows how many instances and parallel execution servers
are allocated. This is shown in the form of
number of instances | number of
                    parallel servers
. - Database Time: Place the cursor over the database time to see a popup displaying the breakdown of time and wait events.
- Start Time: Time when the execution of the SQL statement starts.
- End Time: Time when the execution of the SQL statement ends.
- SQL Text: SQL statement being monitored.
Accessing Real Time SQL Monitor
Real Time SQL Monitor is available in the context menu (right-click) for a connection. Selecting Real Time SQL Monitor opens a table showing all the statements that are currently being monitored or have been monitored in the past.
Click anywhere on a row to access the following details for the corresponding statement:
-
Overview: General information about the monitored statement, Time & wait statistics and IO statistics.
-
Plan Statistics: Explain Plan of the execution of the SQL statement in the form of a table. Each row is a different operation involved in the execution of the SQL statement and it shows hierarchy dependency by adding a space at the beginning of the text in the Operation column.
-
Plan: Explain plan of the execution of the SQL Statement in a tree structure.
-
Metrics: This entry tracks key performance metrics collected for the execution, including the CPU, Memory used, I/O Throughput and I/O Requests time.
Monitored Statements Table Toolbar
- Auto Refresh: Select the time interval (shown in seconds) to refresh the Monitored Statements table.
- Save as: Save the detailed information for a selected statement from the Montiored Statements table as a report.
- Refresh icon: Update the Monitored Statements table.