5.5 Creating Lines to Connect Latitude/Longitude Pairs

The Create lines from start/end points transform operation creates a line connecting two pairs of latitude and longitude coordinates on a map layer.

To perform this transformation analysis, ensure that a dataset comprising two pairs of latitude and longitude coordinates (one represents the starting points and the other, ending points) in each row is added in the Active Project page. The Create lines from start/end points analysis takes the column names of these two pairs of latitude and longitude coordinates as input and generates the line geometry connecting the starting and ending points.
Perform the following steps to run the Create lines from start/end points spatial analysis.
  1. Click Menu Icon against the map layer whose coordinates needs to be filtered in the Layers tab.
  2. Select Spatial Analysis.
    The Spatial Analysis Operations slider opens as shown in Figure 5-1.
  3. Click the Transform tab and select Create lines from start/end points.
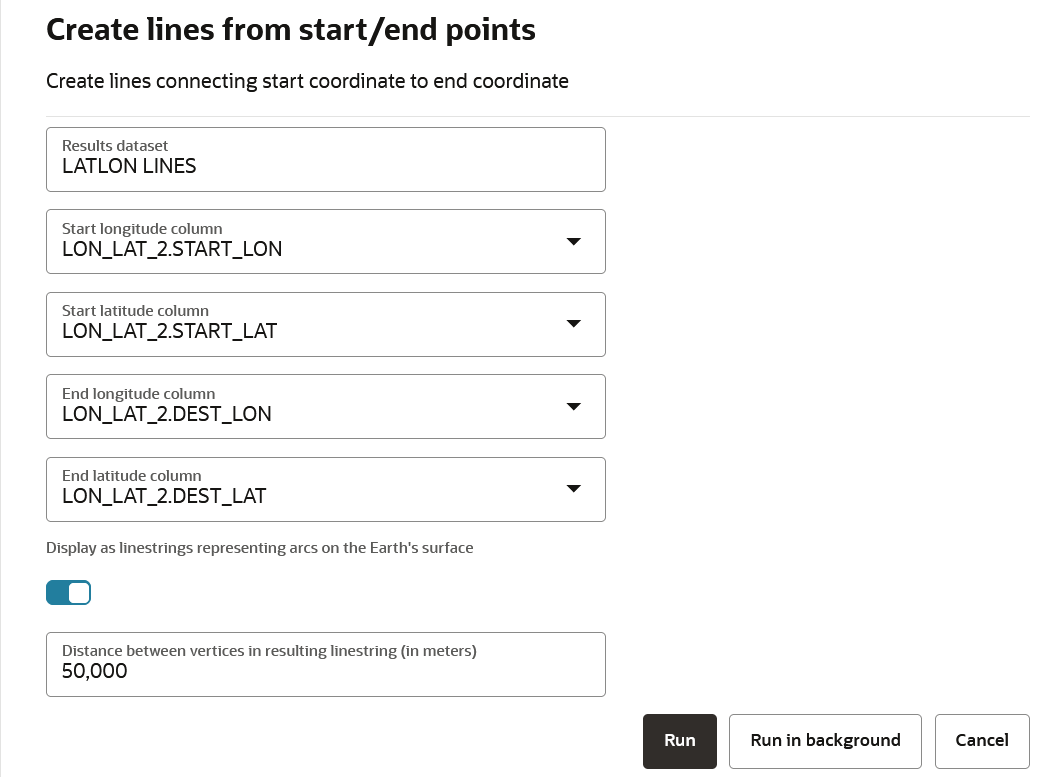
    Create lines from start/end points slider opens as shown:

    Figure 5-9 Configuring Lat/Lon Line Analysis

    Description of Figure 5-9 follows
    Description of "Figure 5-9 Configuring Lat/Lon Line Analysis"
  4. Optionally, modify the resulting datasets name in Results dataset.
  5. Select the Start longitude column.
  6. Select the Start latitude column.
  7. Select the End longitude column.
  8. Select the End latitude column.
  9. Optionally, switch ON the Display as linestrings representing arcs on the Earth's surface toggle.
    This factor takes into consideration that the earth is spherical and accordingly projects the connecting line between the two sets of coordinates on the map layer. It is very useful for large distances between two coordinates and it is recommended that you use this option.
  10. Optionally, modify the Distance between vertices in resulting linestring (in meters) (only if you have included the Display as linestrings representing arcs on the Earth's surface option in the preceding step).
  11. Click Run.
    The Analysis results are listed under Analyses in the Data elements panel on the left pane of the Active Project page.
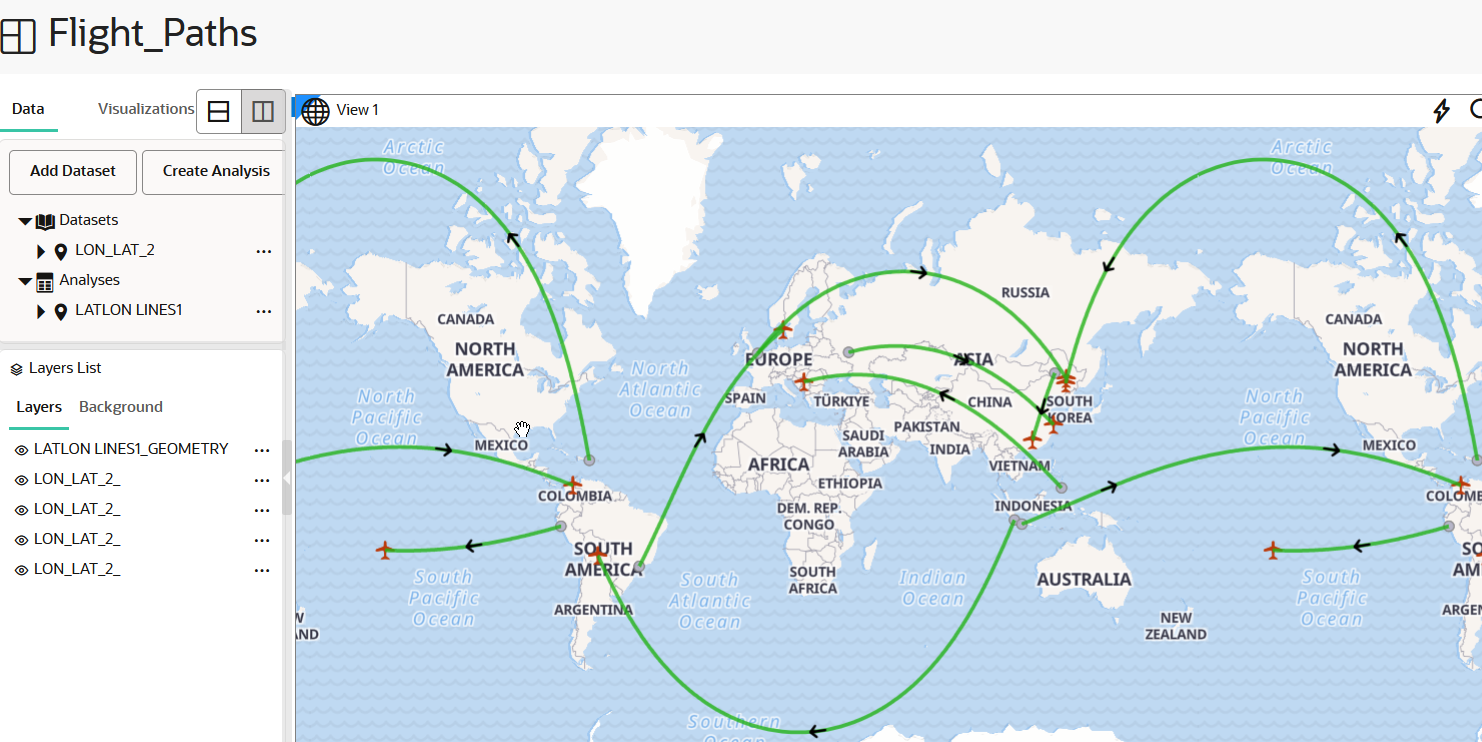
  12. Drag and drop the following layers on the map - starting points, ending points, and finally the GEOMETRY (that connects the starting and ending points) analysis on the map view.
    The following figure shows an example of the Create lines from start/end points spatial analysis:

    Figure 5-10 Visualizing Latitude/Longitude Line Analysis

    Description of Figure 5-10 follows
    Description of "Figure 5-10 Visualizing Latitude/Longitude Line Analysis"