4.2.1 Displaying a Spatial Studio Dataset in a Standalone MapLibre JavaScript Map as Vector Tiles
This section explains how to create a simple one-page HTML page that can display a vector tiles of a dataset in a standalone JavaScript web mapping application written using the open source MapLibre GL JS API library.
- Support displaying vector tiles or GeoJSON data from an external source.
- Support setting a custom HTTP header on its Vector Tile or GeoJSON
requests.
This is needed in order to pass an access token to Spatial Studio.
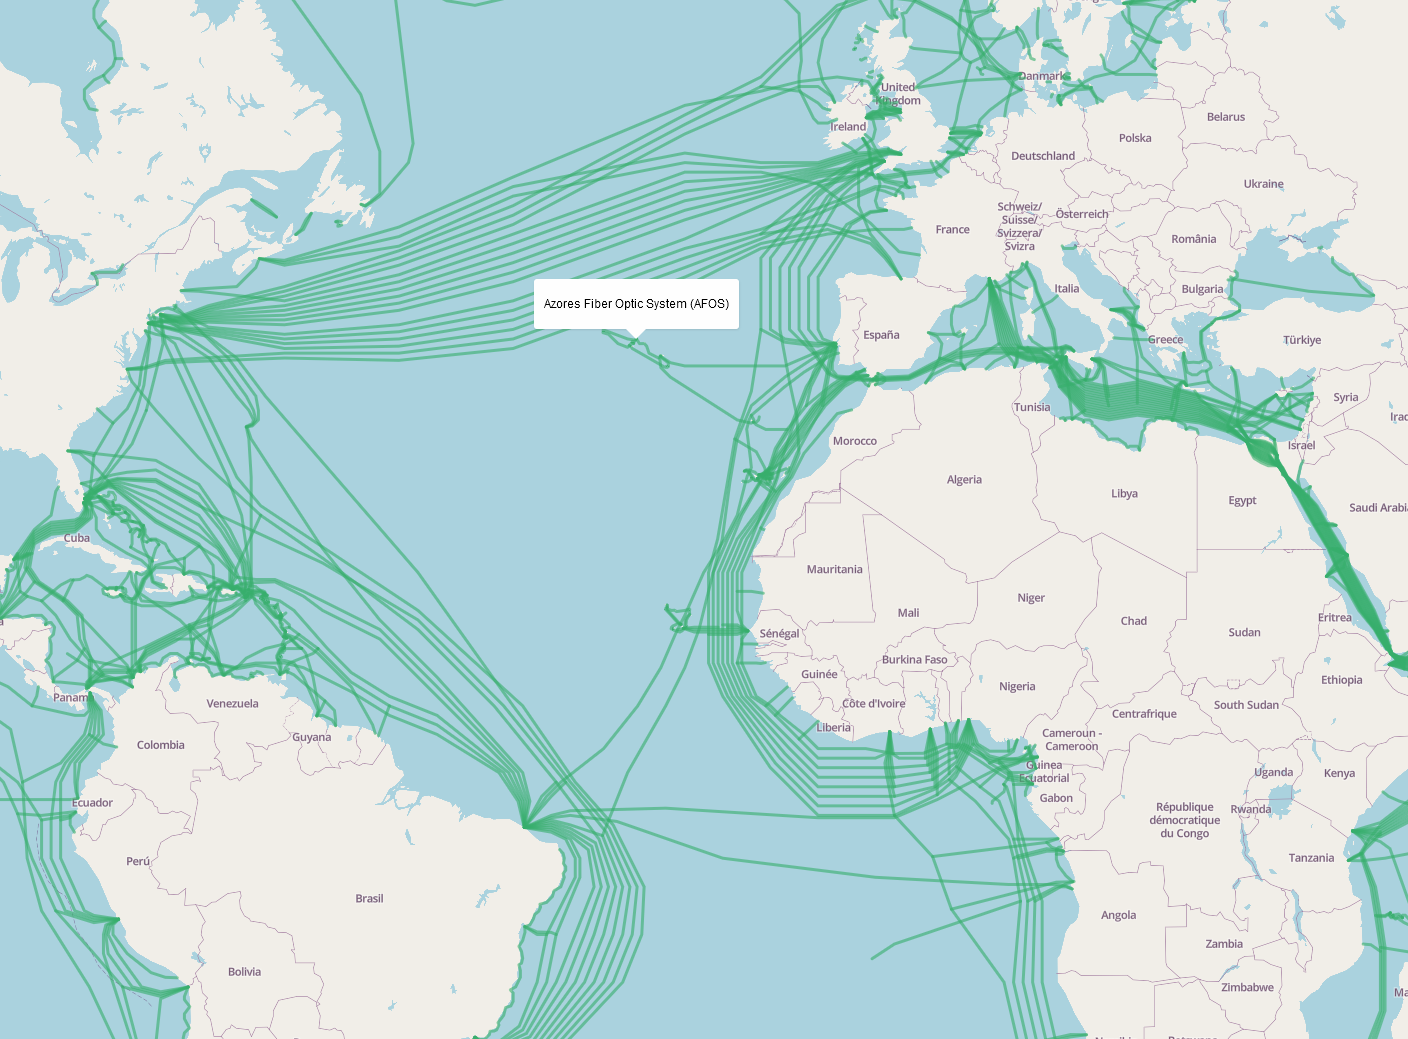
The following example displays the public Submarine Cables dataset that was loaded into an Oracle database table from which a Spatial Studio dataset was created. The access token was obtained from the same Studio server with the type Dataset streaming only. The sample code is as shown:
<!DOCTYPE html>
<html lang="en">
<head>
    <meta charset="utf-8">
    <title>Display vector dataset from Spatial Studio</title>
    <meta name="viewport" content="initial-scale=1,maximum-scale=1,user-scalable=no">
    <script src="https://unpkg.com/maplibre-gl@2.1.9/dist/maplibre-gl.js"></script>
    <link href="https://unpkg.com/maplibre-gl@2.1.9/dist/maplibre-gl.css" rel="stylesheet">
    <style>
        body { margin: 0; padding: 0; }
        #map { position: absolute; top: 0; bottom: 0; width: 100%; }
    </style>
</head>
<body>
<div id="map"></div>
<script>
    const spatialStudio = {
        // the base URL for accessing Spatial Studio dataset's vector tiles using an access token
        baseUrl : 'https://localhost:4040/spatialstudio/oauth/v1',
        // a stream-only access token issued by Spatial Studio
        accessToken: 'eyJ0eXAiOiJzZ3R...HV3koQsYF_MkKQ'
    };

    const map = new maplibregl.Map({
        container: 'map',
        // For demo purpose we will simply create a background map based on the OpenStreetMap from Map Tiler. Note that you must obtain your own API key from maptiler.com. Any Mapbox style basemap works here.
        style: ' https://api.maptiler.com/maps/openstreetmap/style.json?key=YOUR_KEY',
        zoom: 1,
        center: [-122.5, 37.5],

        // This function is used to set the Spatial Studio access token when requesting the vector tiles of a dataset.
        transformRequest: (url, resourceType) => {
            if (resourceType === 'Tile' && url.startsWith(spatialStudio.baseUrl)) {
                return {
                    url: url,
                    headers: {'Authorization': 'Bearer ' + spatialStudio.accessToken}
                }
            }
        }
    });

    map.on('load', function () {
        // Adds the vector tiles for the Spatial Studio dataset with the id "c5e166cdf86a1605ff9fbaa9d04b7378" to
        // the MapLibre map as a source object.
        map.addSource('spatial-studio-vector-tiles', {
            'type': 'vector',
            'tiles': [
                spatialStudio.baseUrl + '/vt/c5e166cdf86a1605ff9fbaa9d04b7378/GEOM/{z}/{x}/{y}.mvt'
            ],
            'minzoom': 0,
            'maxzoom': 10
        });

        // Adds the layer definition for the dataset. Note that vector tiles generated by Spatial Studio always includes only one dataset,
        // and the layer name is always 'LAYER'.
        map.addLayer(
            {
                'id': 'submarine-cables',
                'type': 'line',
                'source': 'spatial-studio-vector-tiles',
                'source-layer': 'LAYER',
                'layout': {
                    'line-cap': 'round',
                    'line-join': 'round'
                },
                'paint': {
                    'line-opacity': 0.6,
                    'line-color': 'rgb(53, 175, 109)',
                    'line-width': 3
                }
            }
        );
    });

    map.addControl(new maplibregl.NavigationControl());

    // Adds a simple popup on hover
    var popup = new maplibregl.Popup({
        closeButton: false,
        closeOnClick: false
    });

    // Defines what happens when you mouse over a feature of the dataset.
    map.on('mouseenter', 'submarine-cables', function (e) {
        // Changes the cursor style as a UI indicator.
        map.getCanvas().style.cursor = 'pointer';

        var coordinates = e.features[0].geometry.coordinates.slice();
        if (Array.isArray(coordinates[0])){
            // Uses the first vertex of the linestring feature under hover as the anchor point for the popup.
            coordinates = coordinates[0];
        }

        // NAME is one of the columns of the dataset. You have access to all the columns of a dataset here.
        var description = e.features[0].properties.NAME;

        // Ensures that if the map is zoomed out such that multiple
        // copies of the feature are visible, the popup appears
        // over the copy being pointed to.
        while (Math.abs(e.lngLat.lng - coordinates[0]) > 180) {
            coordinates[0] += e.lngLat.lng > coordinates[0] ? 360 : -360;
        }

        // Populates the popup with custom HTML contents and sets its coordinates
        // based on the feature found under the mouse pointer. Finally the popup is added to the map.
        popup.setLngLat(coordinates).setHTML(description).addTo(map);
    });

    map.on('mouseleave', 'submarine-cables', function () {
        map.getCanvas().style.cursor = '';
        popup.remove();
    });

</script>

</body>
</html>- Replace the
baseURLandaccessTokenas it applies to your installation. Also, the access token should be of the type Dataset stream only. - Similarly, replace the dataset
idstring to your own. - The access token is set as a request header through MapLibre
API’s
transformRequestoption when constructing a MapLibreMapobject. This option provides MapLibre API with a callback that will be invoked whenever it sends a vector tile request to the Spatial Studio server. - A MapLibre vector type Source object is created and
added to its
Mapobject. From this source object a map layer is defined and added to the map as well. - You have full access to all the columns of the dataset once its data are displayed on the map.
- You can always customize the popup behavior and the contents as they are standard MapLibre GL JS API classes.
When you save the code to a web server and open its URL in a browser window, a similar map as shown will be displayed. The green lines on the map are the features of the Spatial Studio dataset containing submarine cables.
Figure 4-1 Displaying Vector Tiles of a Dataset in the MapLibre Application

Description of "Figure 4-1 Displaying Vector Tiles of a Dataset in the MapLibre Application"
Parent topic: Accessing Spatial Studio REST API Programmatically