4.3 Themes
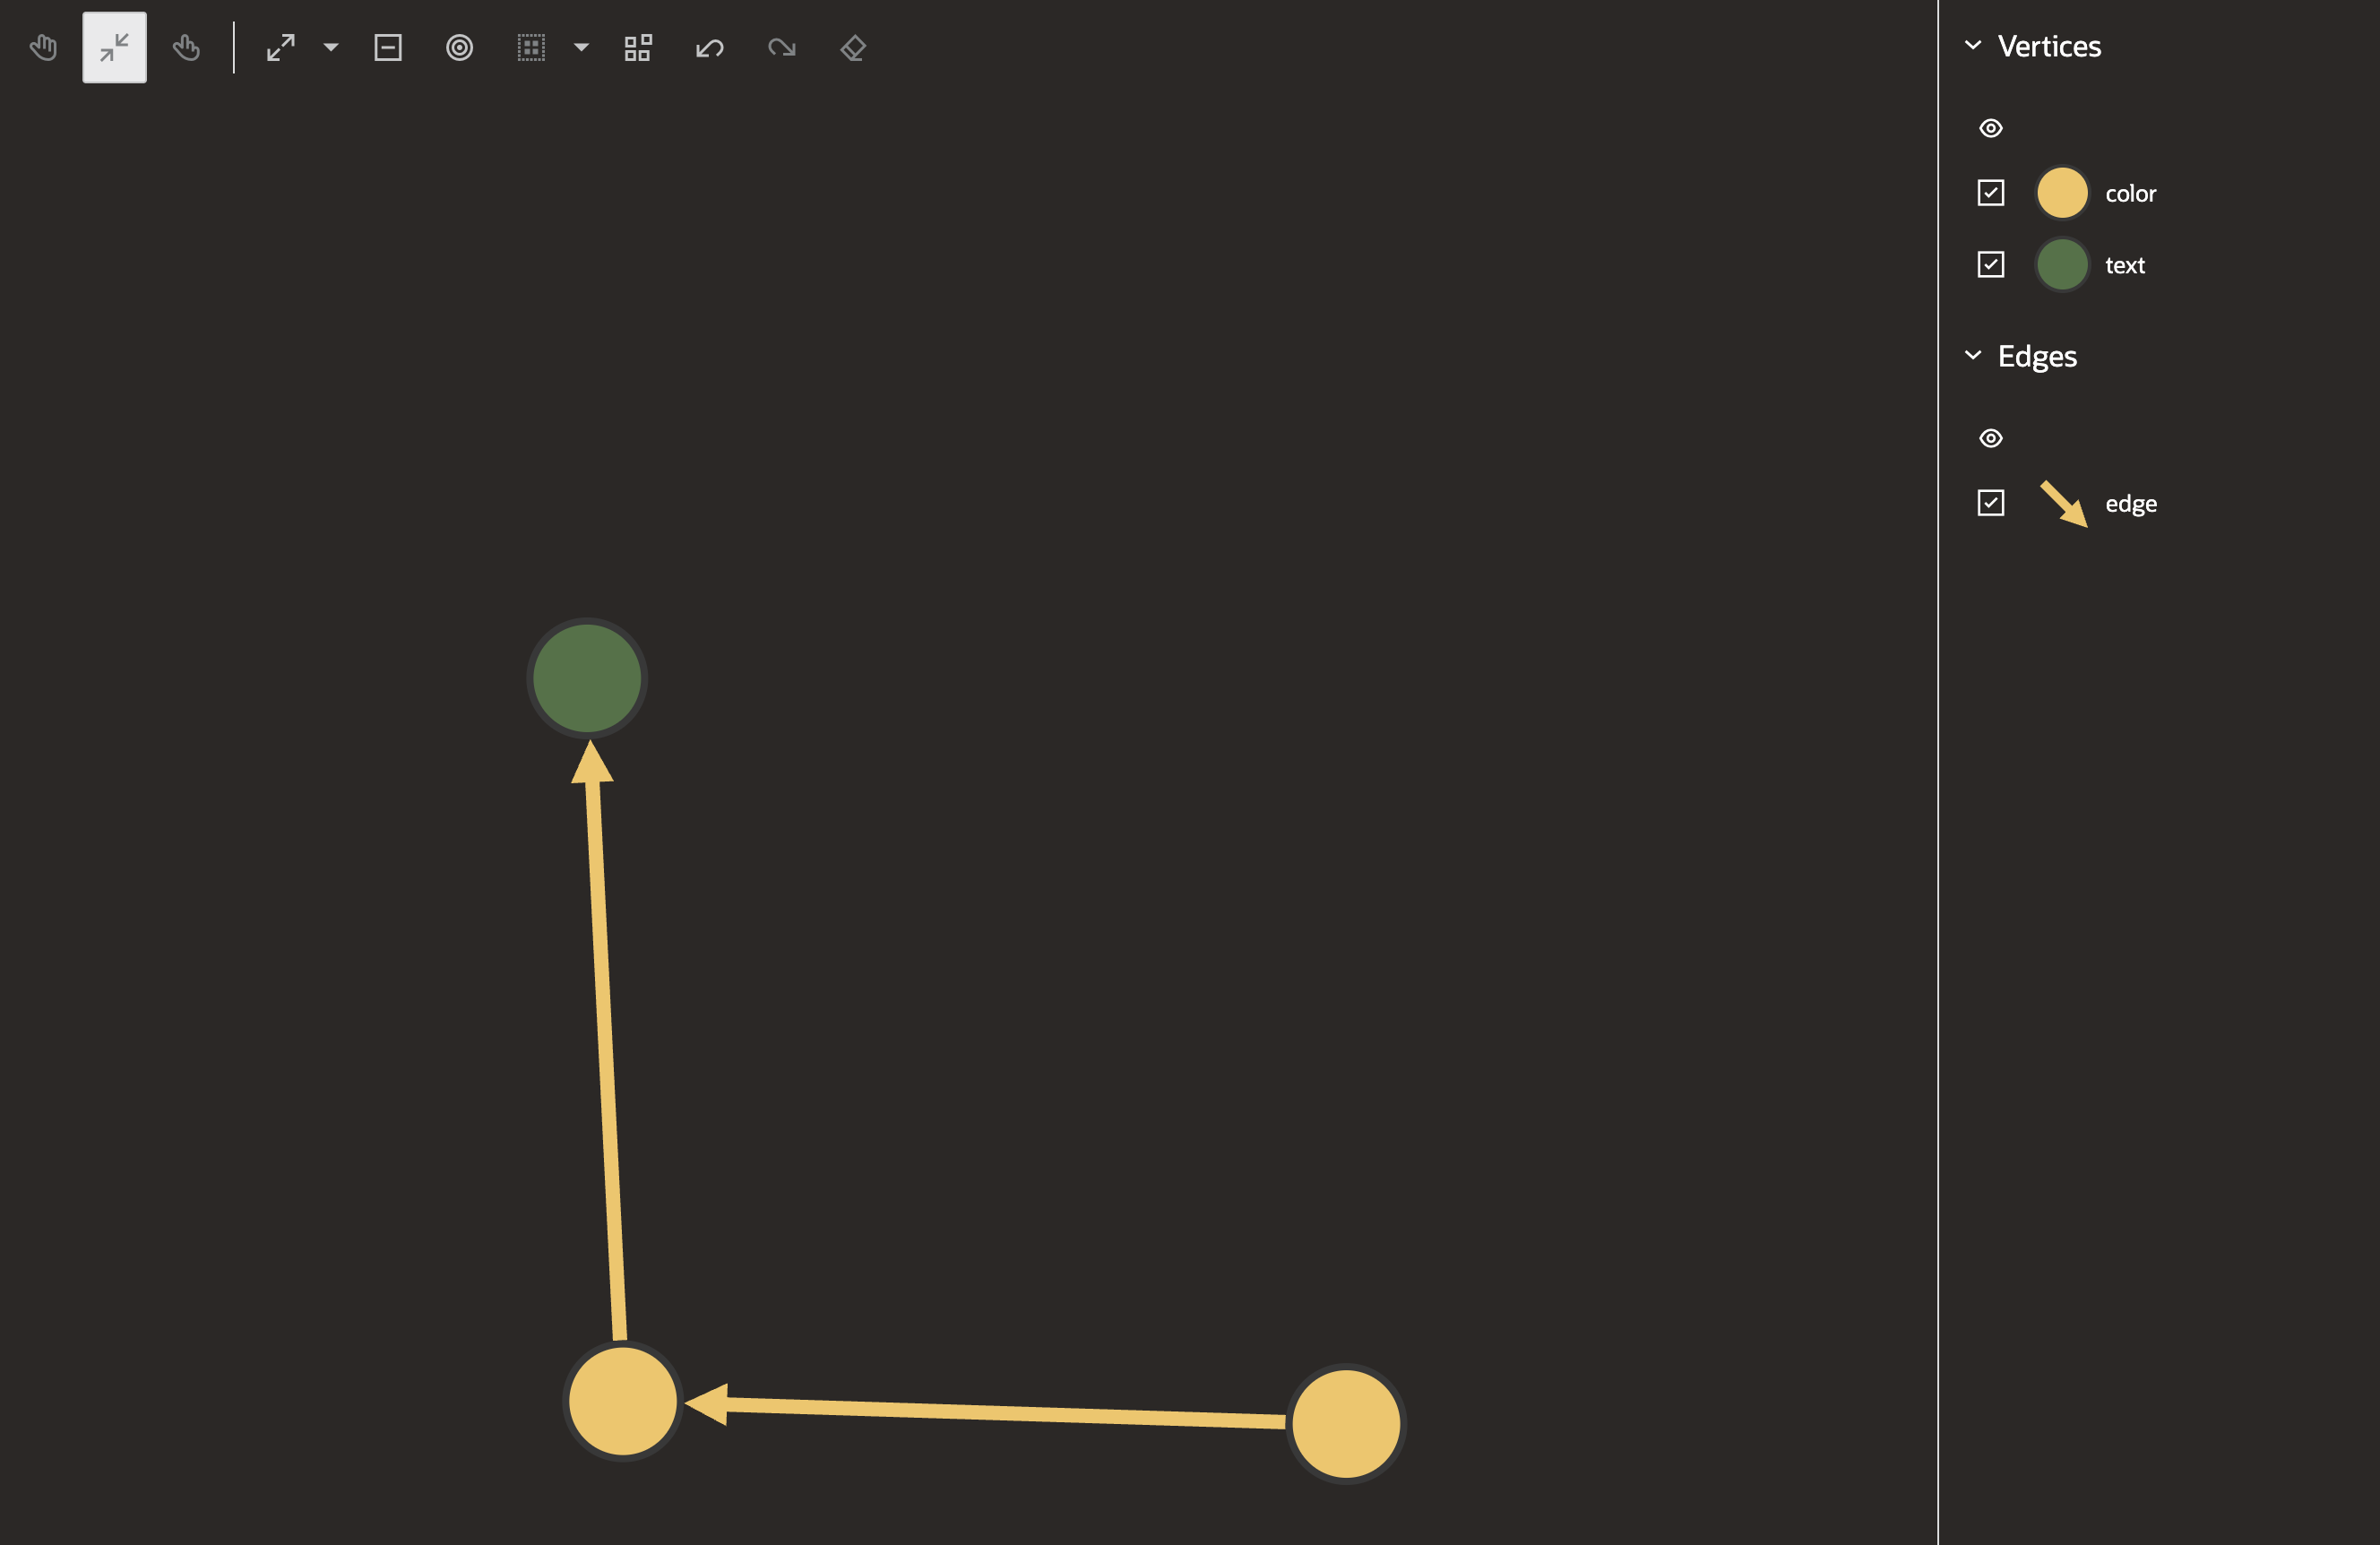
You can enable a dark theme through settings as shown:
// This import is not necessary if you are using Oracle JET.
import '@ovis/graph/alta.css';
import Visualization from '@gvt/graphviz';

const vertices = [
  {
    id: 1,
    properties: {
      label: 'blue',
      name: 'Hello'
    },
    labels:['color']
  },
  {
    id: 2,
    properties: {
      label: 'blue',
      name: 'World'
    },
    labels:['color']
  },
  {
    id: 3,
    properties: {
      name: 'Some Name'
    },
    labels:['text']
  }
];

const edges = [
  {
    id: 1,
    source: 1,
    target: 2,
    labels: ['edge']
  },
  {
    id: 2,
    source: 2,
    target: 3,
    labels: ['edge']
  }
];

const settings = {
  theme: 'dark',
  baseStyles: {
    vertex: {
      label: { text: '${properties.name}' }
    }
  }
};

new GraphVisualization({
  target: document.body,
  props: { data: { vertices, edges }, settings }
});
The corresponding visualization appears as shown:
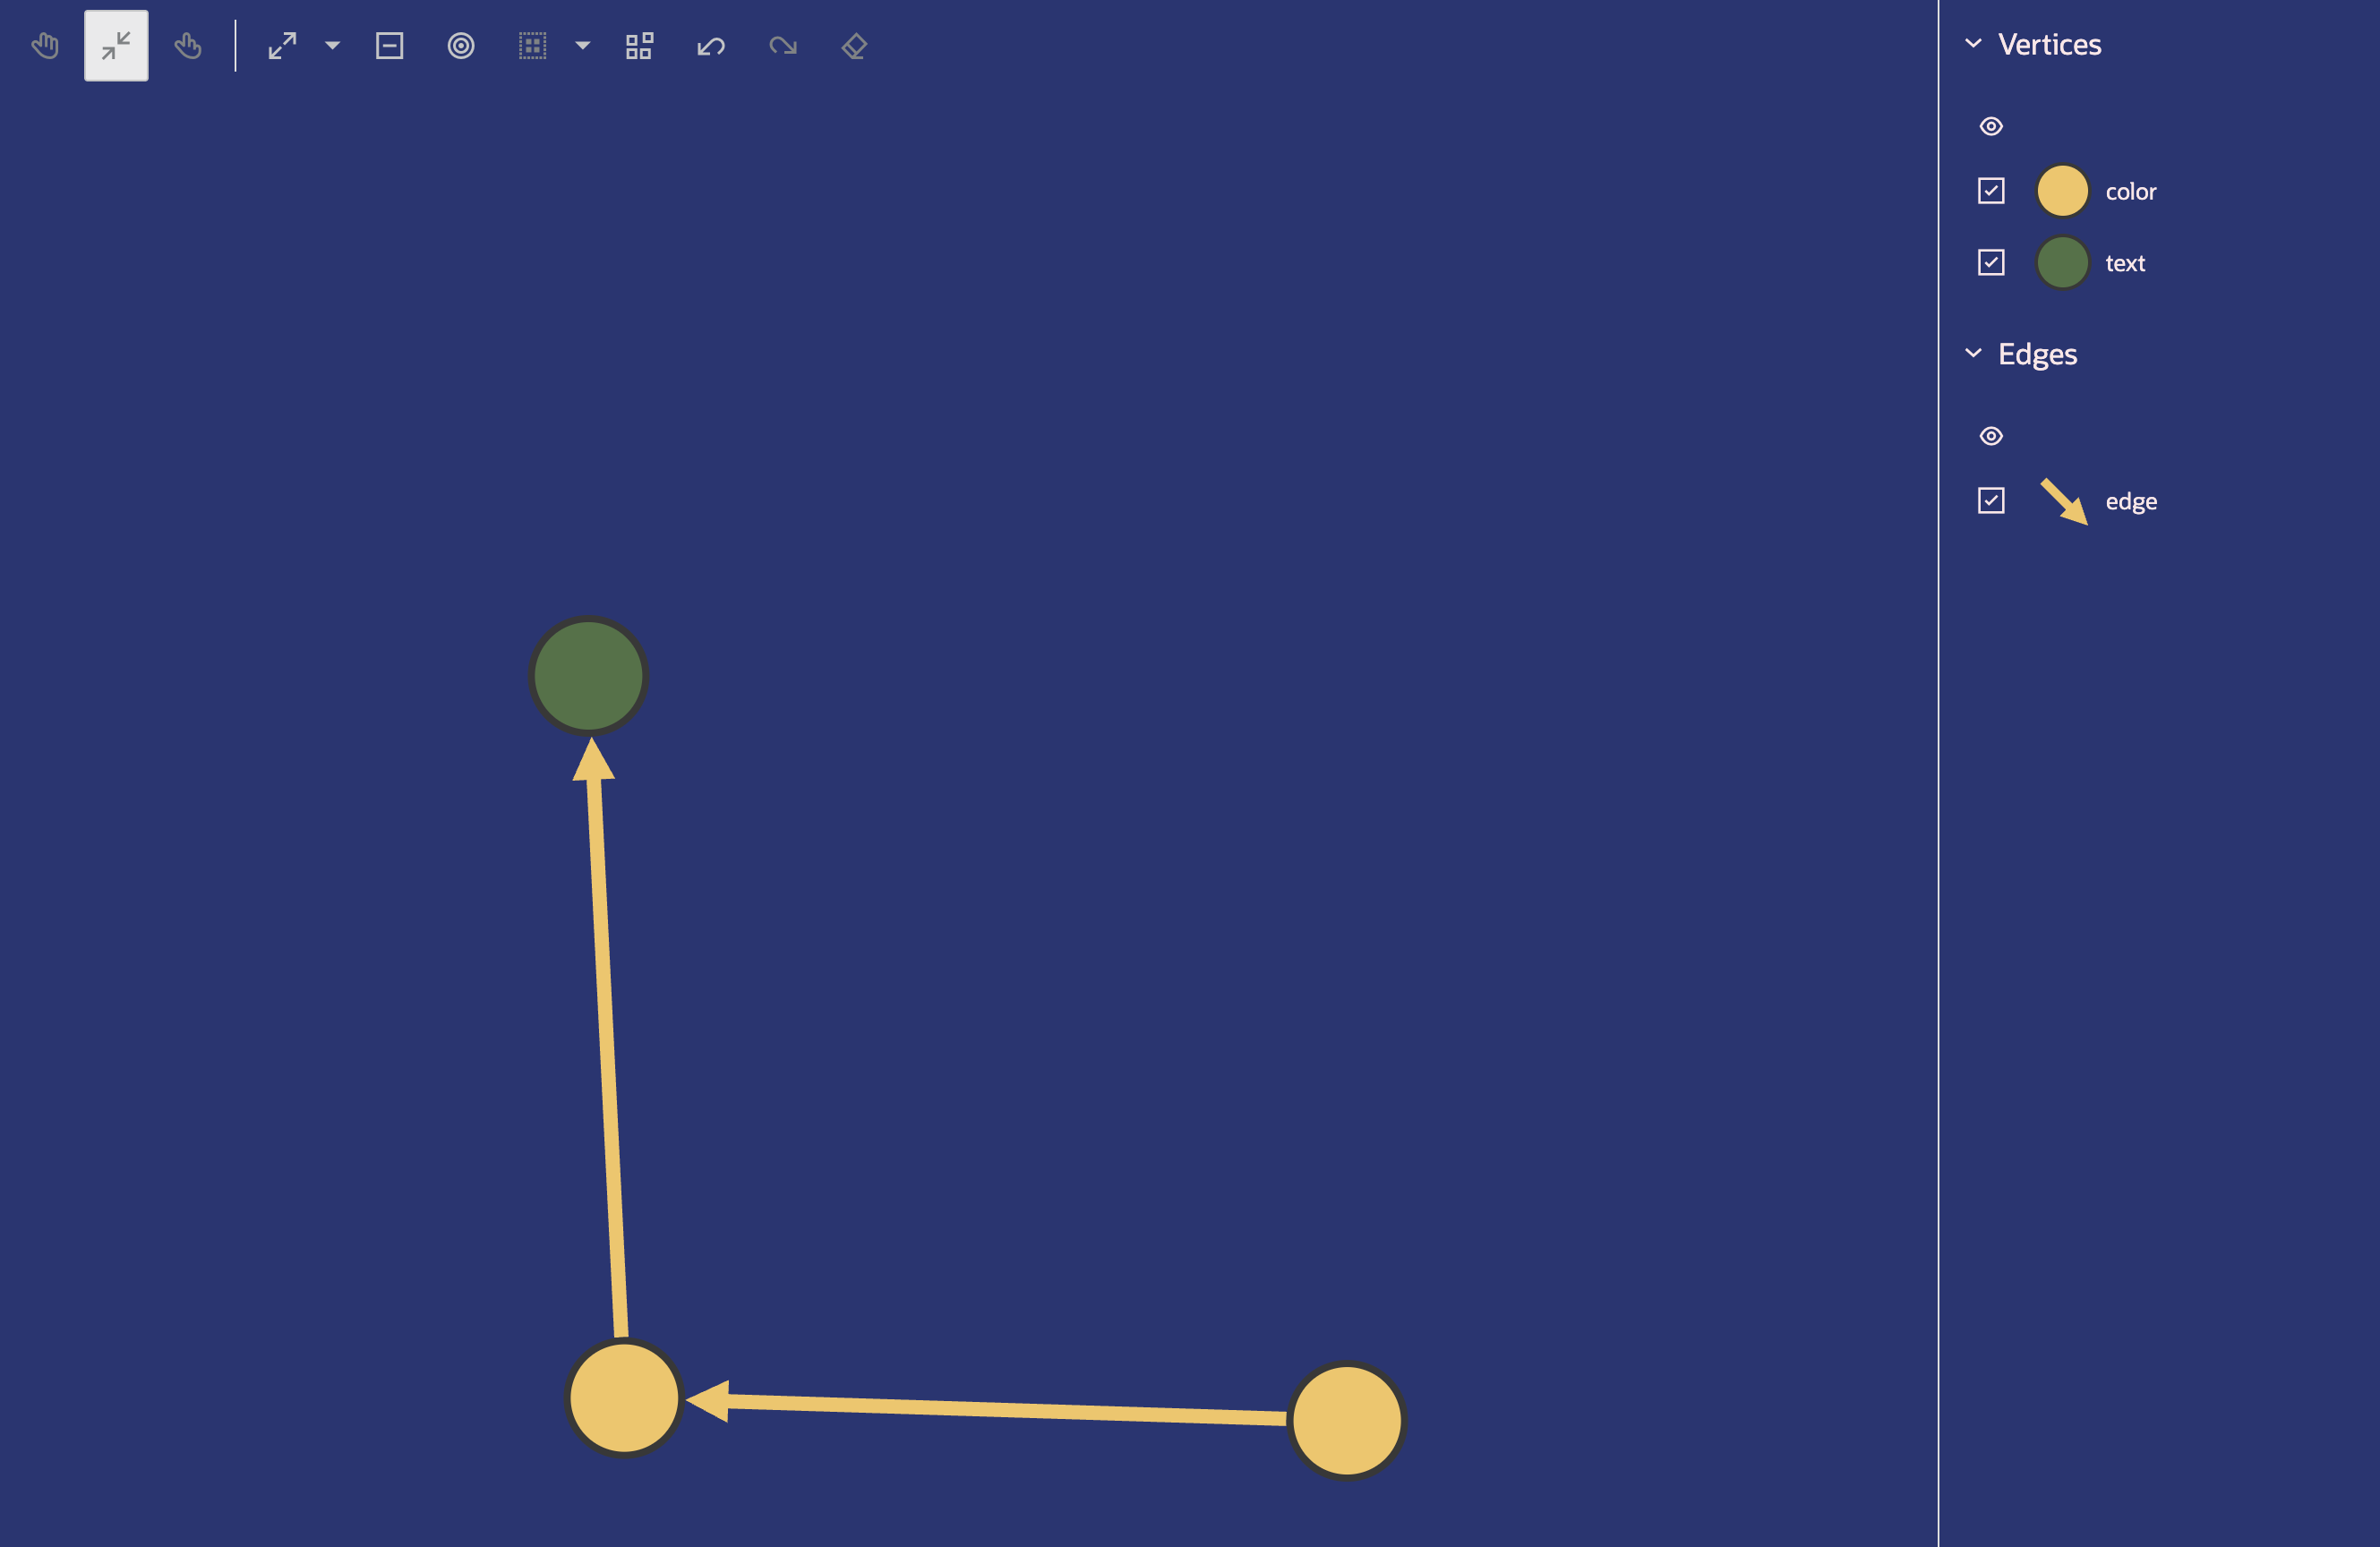
You can also create a customized theme to modify the background and foreground colors.
// This import is not necessary if you are using Oracle JET.
import '@ovis/graph/alta.css';
import Visualization from '@gvt/graphviz';

const vertices = [
  {
    id: 1,
    properties: {
      label: 'blue',
      name: 'Hello'
    },
    labels:['color']
  },
  {
    id: 2,
    properties: {
      label: 'blue',
      name: 'World'
    },
    labels:['color']
  },
  {
    id: 3,
    properties: {
      name: 'Some Name'
    },
    labels:['text']
  }
];

const edges = [
  {
    id: 1,
    source: 1,
    target: 2,
    labels: ['edge']
  },
  {
    id: 2,
    source: 2,
    target: 3,
    labels: ['edge']
  }
];

const settings = {
  customTheme: {
    'backgroundColor': '#2F3C7E',
    'textColor': '#FBEAEB'
  },
  baseStyles: {
    vertex: {
      label: { text: '${properties.name}' }
    }
  }
};

new GraphVisualization({
  target: document.body,
  props: { data: { vertices, edges }, settings }
});
The custom theme gets applies as shown:
Also, note the following:
- If both dark theme and custom theme are applied simultaneously, the colors defined in the custom theme will take precedence over the dark theme colors.
- If the settings specify a label color, the label will use the color from the label settings rather than the color from the theme settings.
Parent topic: Usage Examples

