8.1 About the APEX Graph Visualization Plug-in
The APEX Graph Visualization plug-in integrates a Java Script Library that supports graph visualization in APEX applications.
See Graph JavaScript API Reference for Property Graph Visualization for more information.
The plug-in mainly allows you to:
- Visualize SQL property graph queries from the graph data in your database.
- Explore the graph vertices and edges. You can also select and visualize these graph elements individually or in groups.
- Interact with the graph visualization by performing various actions such as changing the graph layouts, grouping or ungrouping selected vertices, removing selected vertices or edges, and so on.
- Style the vertices and edges in the graph by configuring the style settings such as size, color, icon, label values, and so on.
- Visualize and study the evolution of the graph over time.
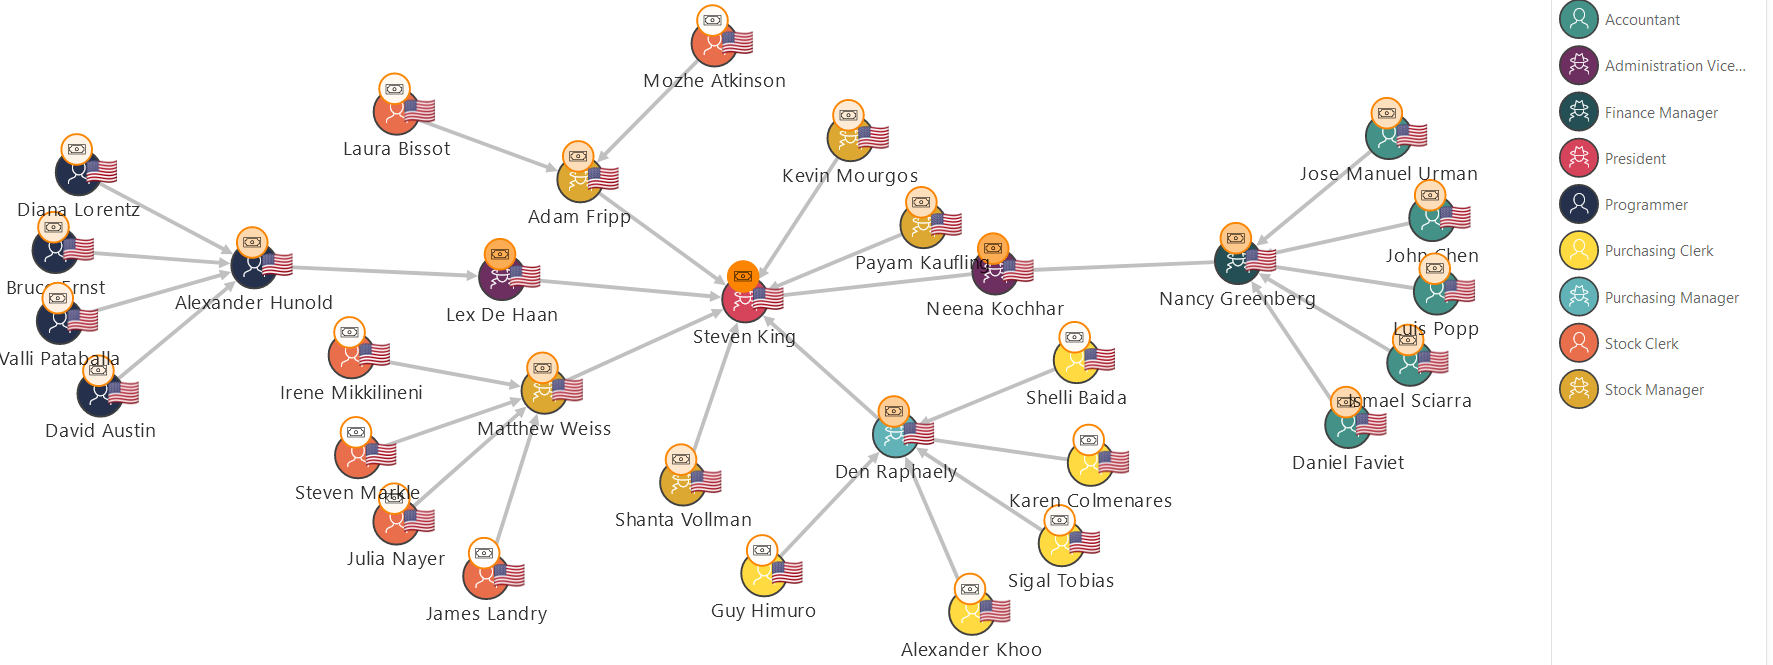
The following figure shows an example of graph visualization in an APEX application using the plug-in:

Description of the illustration apex_graphviz_plugin.png
Note that the plug-in supports icons in the Font APEX library.