3.2.4 Deploy the Model
Here are several approaches to deploy your OML4R model and leverage its insights:
Prediction using R API:
This is the simplest method, ideal for quick analysis or prototyping. You can directly use the fitted model within your R environment to make predictions on new data.
pred <- predict(km.mod.ere, CUST_DF_CLEAN, supplemental.cols = "CUST_ID")

print(pred)  # View predictions for new data
Deploy model in different database:
For production deployments within the different database, leverage the built-in functionalities:
- Export: Use DBMS_DATA_MINING.EXPORT_SERMODEL to export the trained model (CUST_CLUSTER_MODEL_ERE) to a BLOB object in Database 1.
- Transfer: Move the BLOB object (e.g., BFile) to Database 2.
- Import: Use DBMS_DATA_MINING.IMPORT_SERMODEL in Database 2 to import the model from the transferred BLOB object.
Running a user-defined R function from R and SQL, and on ADB REST:
For periodic model updates with new data, create a user-defined R function:
- Define model settings (number of clusters, distance metric, etc.).
- Drop any existing model named CUST_CLUSTER_MODEL_ERE (optional).
- Train the model using ore.odmKMeans.
- Optionally, generate predictions for new data and display them.
Schedule this script to run periodically using Oracle's scheduling features.
Example 3-1 Defining the R function in the script repository and running it from R
#suppress warnings#
options(warn=-1)

build.km.1 <- function(){
    settings = list('KMNS_ITERATIONS'='10',
           'KMNS_DISTANCE'='KMNS_EUCLIDEAN',
           'KMNS_NUM_BINS'='10',
           'KMNS_DETAILS'='KMNS_DETAILS_ALL',
           'PREP_AUTO'='ON',
           'MODEL_NAME'='CUST_CLUSTER_MODEL_ERE')

    ore.exec(paste("BEGIN DBMS_DATA_MINING.DROP_MODEL('CUST_CLUSTER_MODEL_ERE'); EXCEPTION WHEN OTHERS THEN NULL; END;", sep=""))

    km.mod.ere <- ore.odmKMeans(~ . -CUST_ID, CUST_DF_CLEAN, num.centers=3, odm.settings=settings)

    # Show predictions
    pred <- predict(km.mod.ere, CUST_DF_CLEAN, supplemental.cols="CUST_ID")
    pred
}

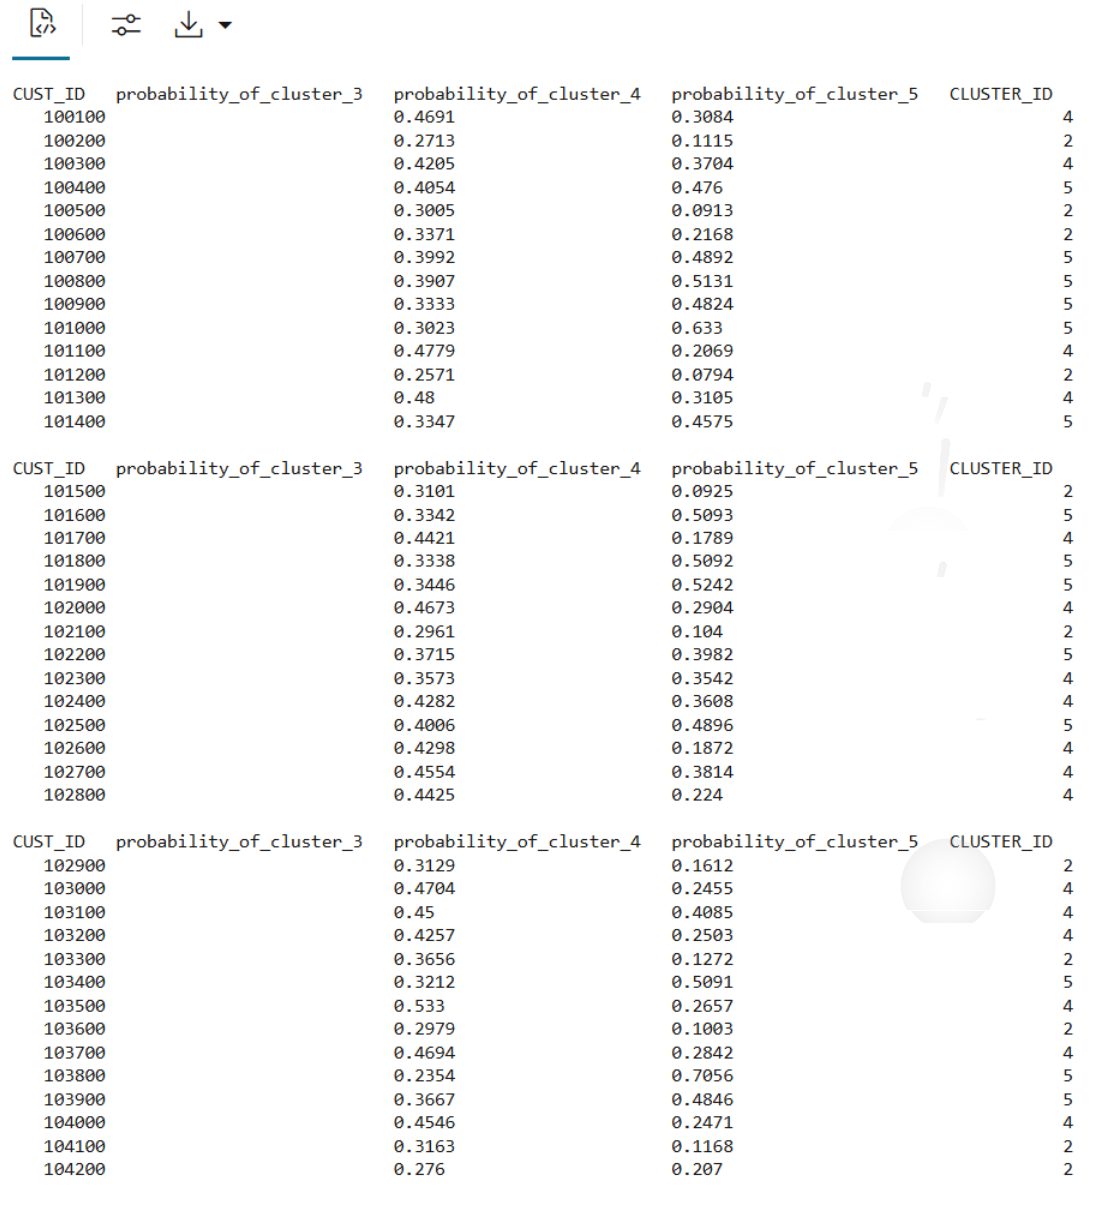
ore.doEval(FUN = build.km.1)
The output appears as follows:

Example 3-2 Running the user-defined R script from SQL
--set the access token
exec rqSetAuthToken('<access token>');

--run user-defined R script from SQL
SELECT *
  FROM table(
    rqEval2(
         NULL,
        '{"CUST_ID": "NUMBER", "probability_of_cluster_3": "BINARY_DOUBLE", "probability_of_cluster_4": "BINARY_DOUBLE",
          "probability_of_cluster_5": "BINARY_DOUBLE", "CLUSTER_ID": "NUMBER"}',
        'build.km.1'));
The SQL output appears as follows:

Example 3-3 Running the R script from ADB REST using CURL command:
curl -i -X POST --header "Authorization: Bearer ${token}" \
--header 'Content-Type: application/json' --header 'Accept: application/json' \
-d '{}' \
"<oml-cloud-service-location-url>/oml/api/r-scripts/v1/do-eval/build.km.1"
The REST response appears as follows:
{

    "result": [

        {

            "probability_of_cluster_5": 0.3084,

            "CUST_ID": 100100,

            "probability_of_cluster_4": 0.4691,

            "'2'": 0.2224,

            "CLUSTER_ID": 4

        },

        {

            "probability_of_cluster_5": 0.1115,

            "CUST_ID": 100200,

            "probability_of_cluster_4": 0.2713,

            "'2'": 0.6172,

            "CLUSTER_ID": 2

        },

        ……

        {

            "probability_of_cluster_5": 0.3974,

            "CUST_ID": 104498,

            "probability_of_cluster_4": 0.4256,

            "'2'": 0.177,

            "CLUSTER_ID": 4

        },

        {

            "probability_of_cluster_5": 0.273,

            "CUST_ID": 104499,

            "probability_of_cluster_4": 0.4102,

            "'2'": 0.3168,

            "CLUSTER_ID": 4

        }

    ]

}
Persistent Table for SQL Integration:
There are two different approaches for creating persistent data structures: a dynamic view ('CUST_DF_VIEW') for accessing the latest data and a materialized table ('CUST_DF_CLEAN') for capturing a snapshot of the data.
Example 3-4 Creating a persistent data structure using a dynamic view
- Use the following code to create a view
ore.drop(view="CUST_DF_VIEW") ore.create(CUST_DF,view="CUST_DF_VIEW") - Use the following SQL query to create a view named
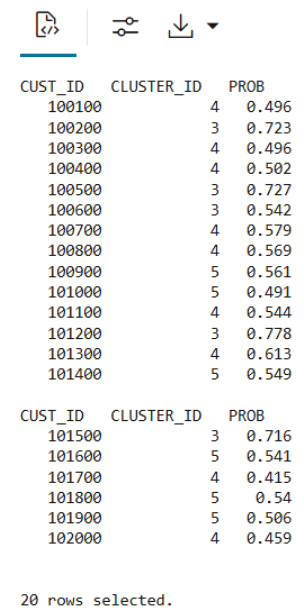
KM_PRED_VIEW. This view will dynamically score data based on the existing viewCUST_DF_VIEW.CREATE OR REPLACE VIEW KM_PRED_VIEW AS SELECT CUST_ID, CLUSTER_ID(CUST_CLUSTER_MODEL_ERE USING *) AS CLUSTER_ID, round (CLUSTER_PROBABILITY (CUST_CLUSTER_MODEL_ERE USING *),3) AS PROB FROM CUST_DF_VIEW; - Use the following code to display first 20 rows of dynamic scoring view 'KM_PRED_VIEW'
select * from KM_PRED_VIEW
where rownum < 21;
The output appears as follows:

Example 3-5 Creating a persistent data structure using a materialized table
- Use the following code to create a table named
CUST_DF_CLEANto store the cleaned data in the database.ore.drop(table="CUST_DF_CLEAN") ore.create(CUST_DF_CLEAN,table="CUST_DF_CLEAN") - Use the following code to create a table named
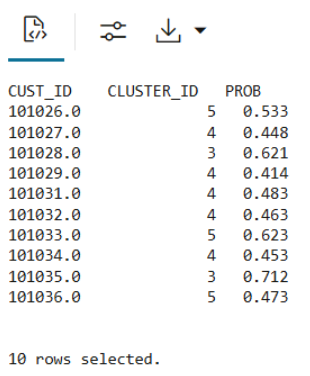
KM_SCORE_TABLE, which will store a static snapshot of the scoring results based on the data in theCUST_DF_CLEANtable.DROP TABLE KM_SCORE_TABLE; CREATE TABLE KM_SCORE_TABLE AS SELECT CUST_ID, CLUSTER_ID(CUST_CLUSTER_MODEL_ERE USING *) AS CLUSTER_ID, round(CLUSTER_PROBABILITY (CUST_CLUSTER_MODEL_ERE USING *),3) AS PROB FROM CUST_DF_CLEAN; - Use the following code to display the first 10 rows of the scoring snapshot table.
select * from KM_SCORE_TABLE where rownum <= 10;The output appears as follows:

- Use the SQL Interface for scoring and then visualize the results using OML Notebooks.
Use the following code to query the table, apply the CLUSTER_SET function for prediction, and extract details from the model output using XML parsing.
SELECT CUST_ID,
       CLUSTER_ID,
       ROUND(PROB*100,0) PROB_PCT,
       RTRIM(TRIM(SUBSTR(OUTPRED."Attribute1",17,100)),'rank="1"/>') FIRST_ATTRIBUTE,
       RTRIM(TRIM(SUBSTR(OUTPRED."Attribute2",17,100)),'rank="2"/>') SECOND_ATTRIBUTE,
       RTRIM(TRIM(SUBSTR(OUTPRED."Attribute3",17,100)),'rank="3"/>') THIRD_ATTRIBUTE
FROM (SELECT CUST_ID, S.CLUSTER_ID, PROBABILITY PROB,
             CLUSTER_DETAILS(KM_CLUSTERING_MODEL USING T.*) DETAIL
      FROM (SELECT V.*, CLUSTER_SET(KM_CLUSTERING_MODEL, NULL, 0.2 USING *) PSET
            FROM CUST_DF_KM V
            WHERE cust_id = ${CUST_ID ='101362','101362'|'102087'| '100456'}) T,
                  TABLE(T.PSET) S
            ORDER BY 2 DESC) OUT,
            XMLTABLE('/Details'
                      PASSING OUT.DETAIL
                      COLUMNS
                      "Attribute1" XMLType PATH 'Attribute[1]',
                      "Attribute2" XMLType PATH 'Attribute[2]',
                      "Attribute3" XMLType PATH 'Attribute[3]') OUTPRED
The output appears as follows:

Parent topic: Clustering Use Case