1.1 Transparency Layer
In the Transparency Layer, users run overloaded R functions within their R environment. These functions generate SQL query that run directly in the database. This is achieved through the use of data.frame proxy tables and views in the R environment, which map to tables and views in the database.
By leveraging these proxy objects, users can also use powerful in-database machine learning algorithms from their R environment. This approach leverages the database as a high-performance computing environment for R, enabling efficient use of database features such as column indexes, query optimization, parallelism, in-memory caching, and table-level partitioning, which can result in a significant boost in performance for operations on database tables.
Transparency Layer for streamlined workflows
The OML4R Transparency Layer simplifies database interactions and enhances your workflow in several ways:
- Data Exploration and Preparation: Leverage the database's processing power for faster data exploration and preparation. OML4R allows you to run R functions that are translated to SQL on your data within the database itself, eliminating the need for data movement. This can translate to significant efficiency gains.
- In-Database Machine Learning: Access and use a wide range of powerful machine learning algorithms directly within the database from your R environment. This streamlines your workflow by keeping both data and analysis within the database.
For more information, see Product Technical Architecture
To create a table from the R data.frame iris, use the ore.create function:
ore.create(iris, table = 'IRIS')If the table already exists, use ore.sync to get a proxy object:
ore.attach()
ore.sync(table = 'IRIS')
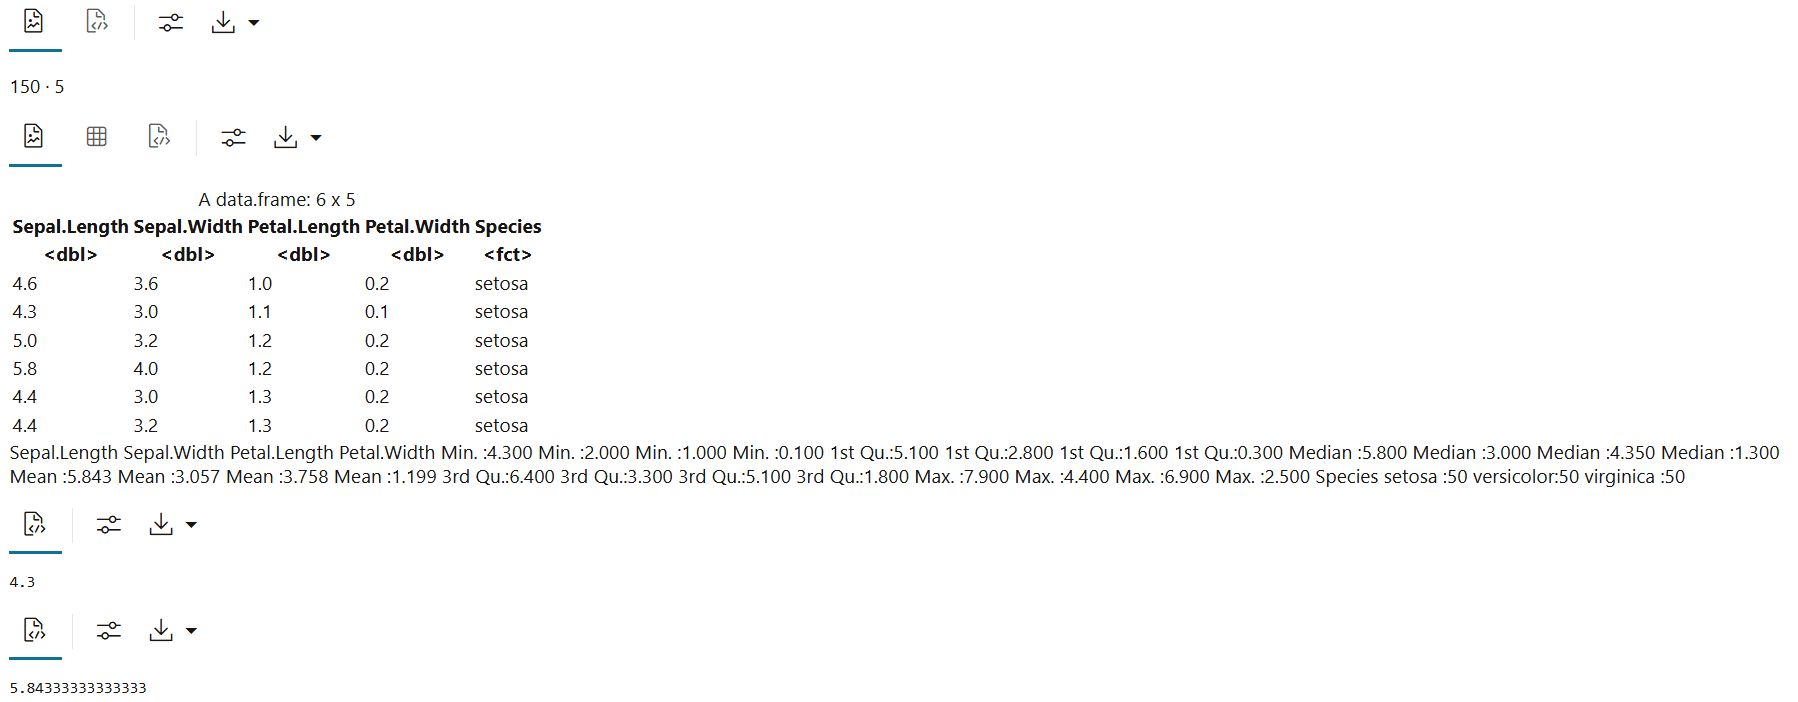
Use the proxy object to run familiar R functions like dim, head, summary, min and mean:
dim(IRIS)
head(IRIS)
summary(IRIS)
min(IRIS$Sepal.Length)
mean(IRIS$Sepal.Length)
The output appears as follows:
OREdplyr offers a streamlined way to interact with Oracle AI Database tables using familiar dplyr functions. By operating directly on the database, it eliminates the need to transfer data to R's memory, allowing for analysis of significantly larger data. Leveraging the database as a high-performance compute engine, OREdplyr provides data manipulation and analysis.
OREdplyr offers a wide range of set of functions for data manipulation and aggregation.
Example of an OREdplyr operation:
library(OREdplyr)
result <- IRIS %>%
  filter(Species == "setosa") %>%
  summarise(mean_sepal_length = mean(Sepal.Length))
To view the overloaded functions in the OML4R transparency layer, run the following code:
ls("package:OREbase")
ls("package:OREstats")
ls("package:OREdplyr")
Data Manipulation
OREdplyr supports the following functions for transforming and restructuring data:
- Selection and Filtering: select, filter, select_, filter_
- Ordering: arrange, arrange_, desc
- Renaming and Modifying: rename, mutate, transmute, rename_, mutate_, transmute_
- Deduplication and Sampling: distinct, slice, distinct_, slice_, sample_n, sample_frac
- Joins: inner_join, left_join, right_join, full_join
Data Summarization
OREdplyr offers the following functions for aggregating and summarizing data:
- Grouping: group_by, groups, ungroup, group_size, n_groups, group_by_
- Aggregation: summarise, summarise_, tally, count, count_
Data Ranking
- Ranking functions: row_number, min_rank, dense_rank, percent_rank, cume_dist, ntile, nth, first, last, n_distinct, top_n
Example: Pushing R data to Oracle AI Database using ore.push and manipulating it with OREdplyr
%r

library(ORE)
library(OREdplyr)
options(ore.warn.order=FALSE)

IRIS <- ore.push(iris)

IRIS_projected1 <- IRIS[, c("Sepal.Length", "Petal.Length")]
z.show(head(IRIS_projected1))
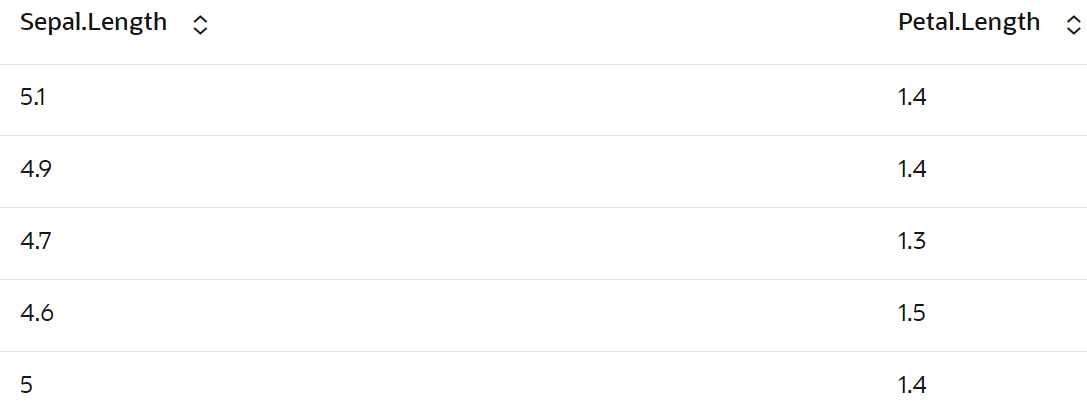
The output appears as follows:
Figure 1-1 Output of Pushing R data to Oracle AI Database
Parent topic: About Oracle Machine Learning for R

