3.2.2 Explore Data
Explore the data to understand and assess the quality of the data. At this stage assess the data to identify data types and noise in the data. Look for missing values and numeric outlier values.
Data Understanding and Preparation
To access database data from Python using OML4Py, you must first create a
oml.DataFrame proxy object in Python which represents a
database table, view, or query. Create a oml.DataFrame proxy object
for SUPPLEMENTARY_DEMOGRAPHICS and CUSTOMERS and then merge them by inner join on an
identical and unique column. Assess the data to identify data types and noise in the
data. Look for missing values (systematic or random), outlier numeric values, or
inconsistently labeled categorical values.
For data preparation and understanding run the following steps:
- Run the following script in a %python interpreter paragraph to
import the
omlmodules, the Panda's module, and set the display options:import pandas as pd import oml pd.set_option('display.max_rows', 500) pd.set_option('display.max_columns', 500) pd.set_option('display.width', 1000) import warnings warnings.simplefilter(action='ignore', category=FutureWarning) - Use the
oml.syncfunction to create the Python objectDEMOGRAPHICSas a proxy for a database tableSUPPLEMENTARY_DEMOGRAPHICS. Theoml.syncfunction returns anoml.DataFrameobject or a dictionary ofoml.DataFrameobjects. Theoml.DataFrameobject returned byoml.syncis a proxy for the database object.DEMOGRAPHICS = oml.sync(table = "SUPPLEMENTARY_DEMOGRAPHICS", schema = "SH") z.show(DEMOGRAPHICS.head())
- Run the shape function to view the rows and columns of an
oml.DataFrame object
DEMO.print("Shape:",DEMOGRAPHICS.shape)(4500, 14) - Use the oml.sync function to create the Python object CUSTOMERS as
a proxy for a database table SH.CUSTOMERS. Like the second step here no schema
is used. With the schema argument, you can specify the schema in which to create
a Python environment and proxy objects. Only one environment for a given
database schema can exist at a time. If
schema=None, then objects are created in the current user's schema.CUSTOMERS = oml.sync(query = 'SELECT CUST_ID, CUST_GENDER, CUST_MARITAL_STATUS, CUST_YEAR_OF_BIRTH, CUST_INCOME_LEVEL, CUST_CREDIT_LIMIT FROM SH.CUSTOMERS') z.show(CUSTOMERS.head())
- Run the shape function to view the rows and columns of an
oml.DataFrame object
CUSTOMERS.
print("Shape:",CUSTOMERS.shape)(55500, 6) - Create a new oml.dataframe CUSTOMER_DATA by merging the table
CUSTOMERS and DEMOGRAPHICS with an inner join on the common column CUST_ID . The
merge function joins one oml.dataframe to another oml.dataframe . The suffixes
parameter is used when the two oml.dataframe have conflicting column names.
CUSTOMER_DATA = CUSTOMERS[["CUST_ID", "CUST_INCOME_LEVEL", "CUST_CREDIT_LIMIT"]].merge(DEMOGRAPHICS[["CUST_ID", "HOUSEHOLD_SIZE", "OCCUPATION", "HOME_THEATER_PACKAGE"]], how = "inner", on = 'CUST_ID',suffixes = ["",""])
z.show(CUSTOMER_DATA.head())
- Run the shape function to view the rows and columns of an
oml.DataFrame object
CUSTOMER_DATA.
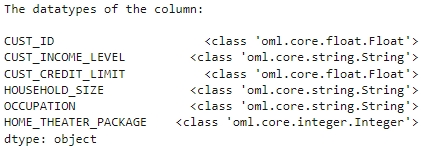
print("Shape:", CUSTOMER_DATA.shape)(4500, 6) - Run the following script to view the data types of all the
columns.
print("The datatypes of the column: ","\n")
print(CUSTOMER_DATA.dtypes)
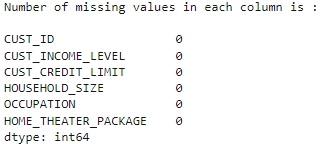
- To check if there are any missing values run the following script.
The count function returns the number of elements that are not NULL for each
column and the len function returns the number of rows in the
dataset.
print("Number of missing values in each column is : \n")
print(len(CUSTOMER_DATA)-CUSTOMER_DATA.count())
- Use the crosstab method to perform a cross-column analysis of an
oml.DataFrame object in the database. The crosstab method computes a
cross-tabulation of two or more columns. By default, it computes a frequency
table for the columns unless a column and an aggregation function have been
passed to it. In this example, the crosstab function displays the distribution
of HOME_THEATER_PACKAGE
responders.
z.show(CUSTOMER_DATA.crosstab('HOME_THEATER_PACKAGE'))
- To know how customers respond to HOME_THEATER_PACKAGE according to
their income level run the following
code:
z.show(CUSTOMER_DATA.crosstab('CUST_INCOME_LEVEL','HOME_THEATER_PACKAGE').sort_values('count', ascending=False).rename(columns = {'count':'NUM_CUSTOMERS'}))
This completes the data understanding and data preparation stage.
Parent topic: Classification Use Case