3.4.2 Explore Data
Explore the data to understand and assess the quality of the data. At this stage assess the data to identify data types and noise in the data. Look for missing values and numeric outlier values.
Note:
Each record in the database is called a case and each case is identified
by a case_id. Here, the case id is TIME_ID, which
is an independent variable. You are forecasting the sales for evenly spaced
time.
The following steps help you with exploratory analysis of the data.
-
Import libraries
Run the following script in a
%pythoninterpreter paragraph to import theomlmodules, the Panda's module, and set the display options:import oml import pandas as pd import numpy as np import matplotlib.pyplot as plt pd.set_option('display.max_rows', 500) pd.set_option('display.max_columns', 500) pd.set_option('display.width', 1000) import warnings warnings.simplefilter(action='ignore', category=FutureWarning) -
Create a DataFrame proxy object on the SH.SALES table
Use theoml.syncfunction to create the Python object SALES as a proxy for a database table SALES. Theoml.syncfunction returns anoml.DataFrameobject.Note:
Only one environment for a given database schema can exist at a time. If"schema=None", then objects are created searched in the current user's schema.SALES = oml.sync(table = "SALES", schema = "SH") z.show(SALES.head())
-
Sales dataset row and column Count
To determine the number of rows and columns in the
oml.DataFrameobject SALES, useDataFrame.shape.print(f"Rows: {SALES.shape[0]}, Columns: SALES.shape[1]}")Rows: 918843, Columns: 7 -
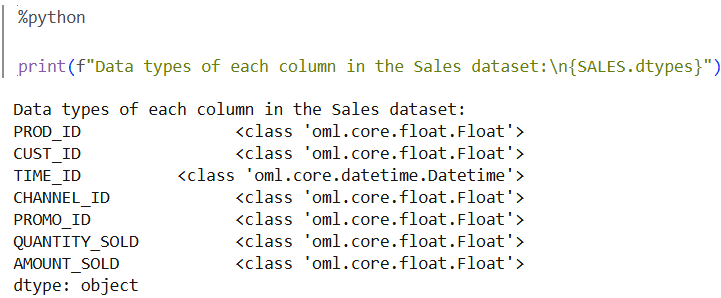
Sales Dataset Column Types
Run the following script to view the data type of each column.print(f"Data types of each column in the Sales dataset:\n{SALES.dtypes}")
-
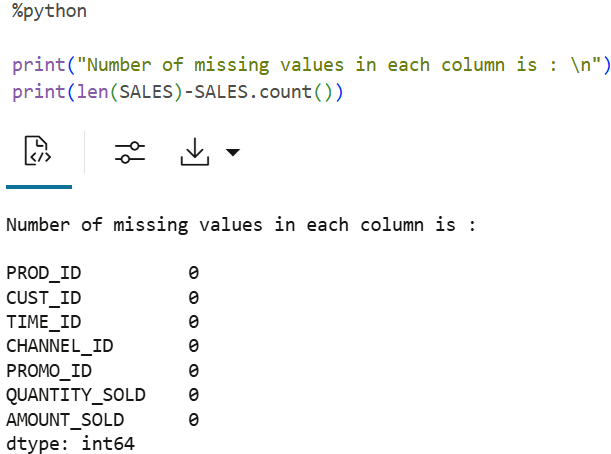
Count of missing values by column
To check if there are any missing values run the following script. The count function returns the number of elements that are not NULL for each column and the
len()function returns the number of rows in the dataset.print("Number of missing values in each column is : \n") print(len(SALES)-SALES.count())
-
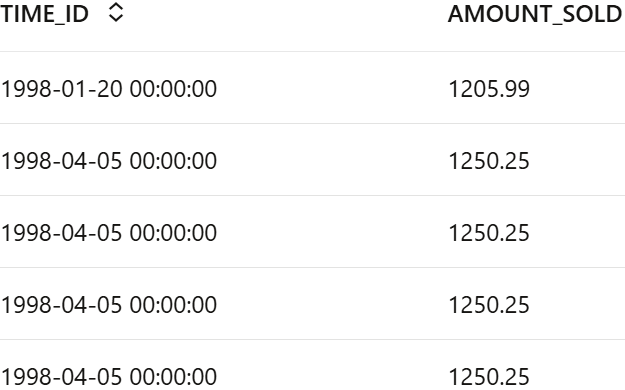
Prepare data to forecast sales by selecting needed columns and view content
Now, prepare a Python proxy object called
ESM_SH_DATAby selecting the necessary columns fromSH.SALEStable. For this use case, selectTIME_IDandAMOUNT_SOLD.ESM_SH_DATA= SALES[['TIME_ID', 'AMOUNT_SOLD']] z.show(ESM_SH_DATA.head())
-
ESM_SH_DATA rows and columns
Determine the shape of
ESM_SH_DATA:print(f"Rows: {ESM_SH_DATA.shape[0]}, Columns: ESM_SH_DATA.shape[1]}")Rows: 918843, Columns: 2
This completes the data exploration stage.
Parent topic: Time Series Use Case