3.4.4 Evaluate
Evaluate your model by viewing diagnostic metrics and performing quality checks.
Sometimes querying dictionary views and model detail views is sufficient to measure your model's performance. However, you can evaluate your model by computing test metrics such as conditional log-likelihood, Average Mean Squared Error (AMSE), Akaike Information Criterion (AIC), and so on.
Information about Model settings
Evaluate the model by examining the various statistics generated after building the model. The statistics indicate the model's quality.
-
Review the forecast model settings
Run the following script for model details available through the GLM model object, like the model settings, attribute coefficients, fit details, etc.
z.show(ESM_MOD)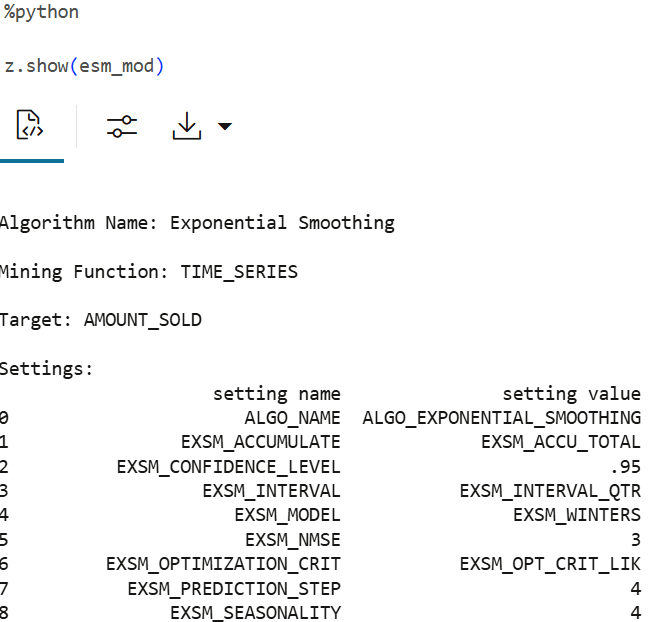
-
Review global diagnostics and model quality
Review the global diagnostics and model settings: Run the following script to display the model's global statistics.
z.show(ESM_MOD.global_stats)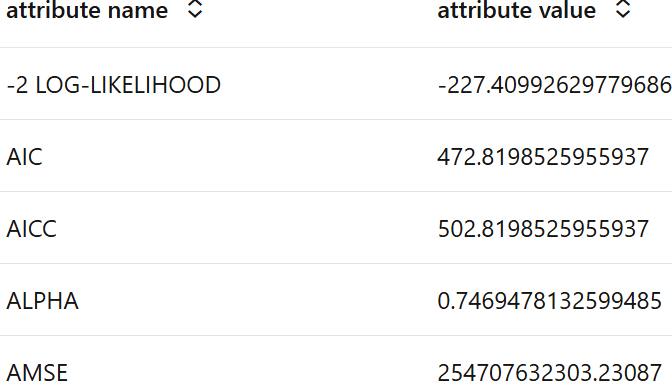
The attributes shown above are:
-2 Log_LIKELIHOOD: It is a statistical measure that evaluates how well a model fits the data. Specifically, it is calculated as twice the negative log-likelihood of the model. Generally, a lower value indicates a better-fit model. It’s often used to compare models, alongside criteria like AIC and BIC, for evaluating overall model performance.AIC: The Akaike Information Criterion (AIC) is used for model comparisions. It penalizes model complexity. Lower AIC indicates a better model.AICC: The Corrected Akaike Information Criterion (AICc) is a statistical measure used for model selection, particularly in the context of data analysis. It adjusts the Akaike Information Criterion (AIC) for small sample sizes, providing a more accurate estimate of the expected Kullback–Leibler discrepancy. The AICc is defined mathematically and is particularly useful when dealing with models that have a large number of parameters relative to the sample size.ALPHA: It is the smoothing parameter and ranges between 0 and 1. For exponential smoothing algorithm(Holt-Winters) it signifies the sensitivity of the forcast to recent changes in the data. Higher values indicate increased sensitivity.AMSE: AMSE, or Average Mean Squared Error measures the difference between the actual and forcasted value. It penalizes the higger errors. Lower AMSE values means better forcast accuracy.
Forecast
Here you will forecast sales for the next four quarters.
-
Forecast AMOUNT SOLD
The model, ESM_MOD, predicts 4 values into the future with LOWER and UPPER condifence bounds. The results are sorted by descending time sequence so that the latest points are shown first.
z.show(ESM_MOD.prediction.sort_values(by='TIME_SEQ',
          ascending=False))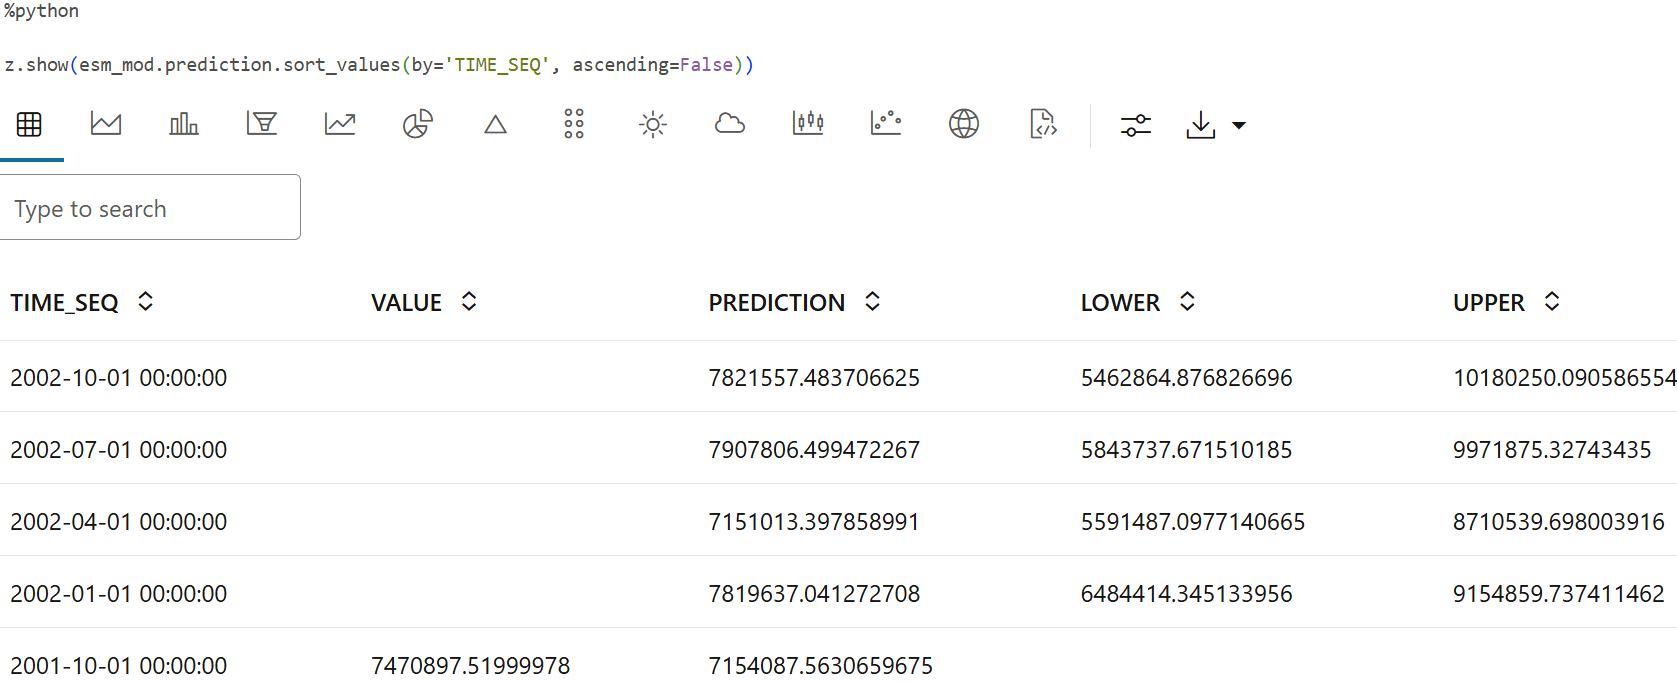
-
Chart forecasted AMOUNT_SOLD values with confidence intervals
To see a visual representation of the predictions in OML Notebooks, run the above same query with the following settings:
z.show(ESM_MOD.prediction.sort_values(by='TIME_SEQ'))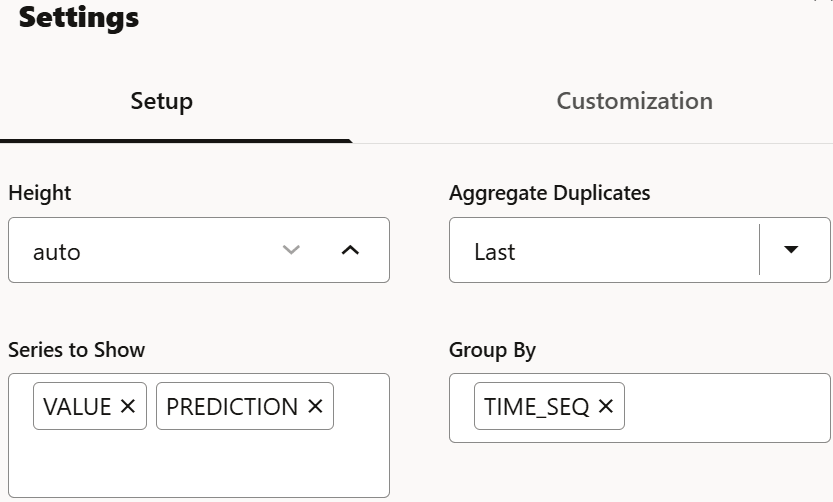
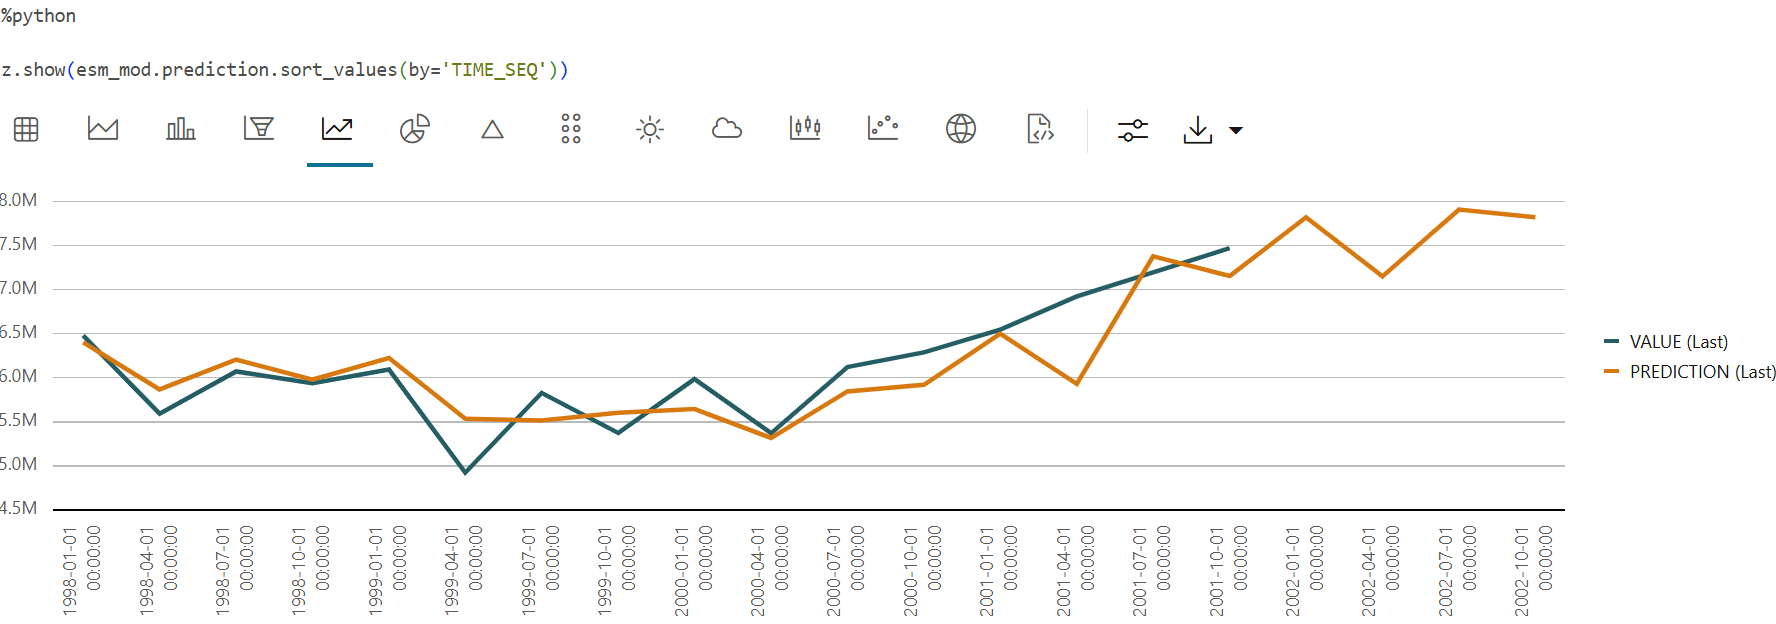
This completes the prediction step. The model has successfully forecast sales for the next four quarters. This helps in tracking the sales and also gives us an idea on stocking our products.
Parent topic: Time Series Use Case