4.7 Use the SQL Interpreter in a Notebook Paragraph
An Oracle Machine Learning notebook supports multiple languages. Each paragraph is associated with a specific
interpreter. For example, to run SQL statements use the SQL interpreter. To run PL/SQL
statements, use the script interpreter.
In an Oracle Machine Learning notebook, you can add multiple paragraphs, and each paragraph can be connected to
different interpreters such as SQL or Python. You identify which interpreter to use
by specifying % followed by the interpreter to use:
sql, script, r,
python, conda, markdown.
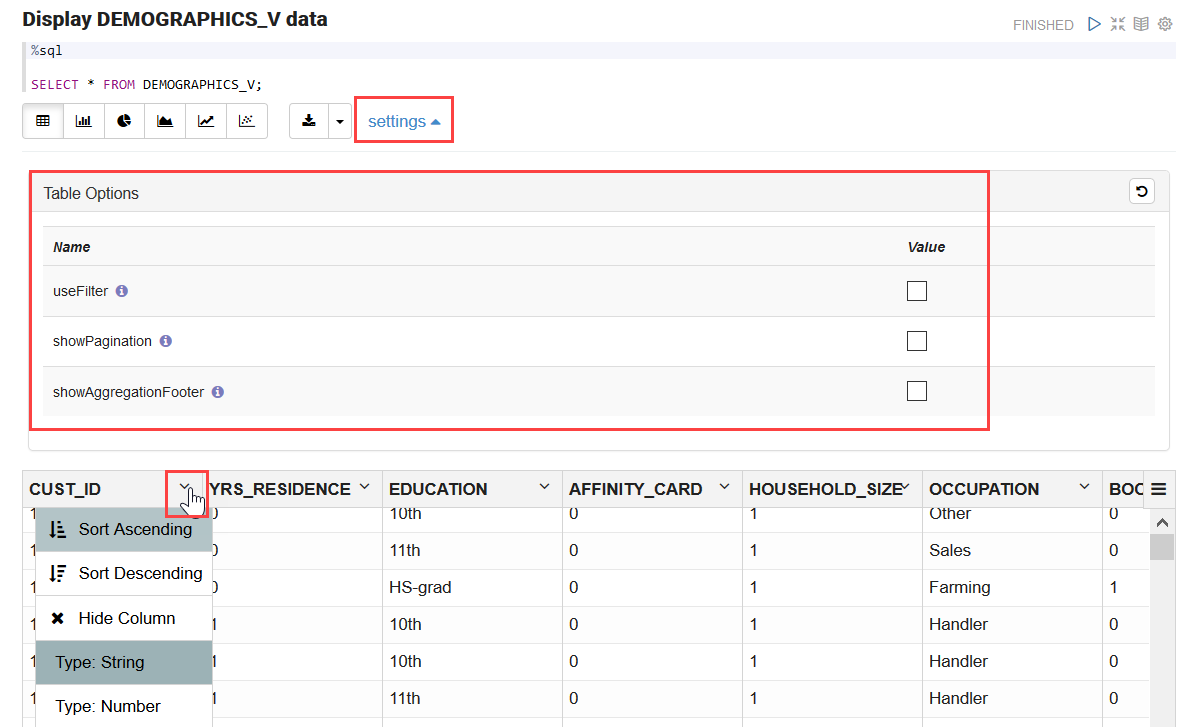
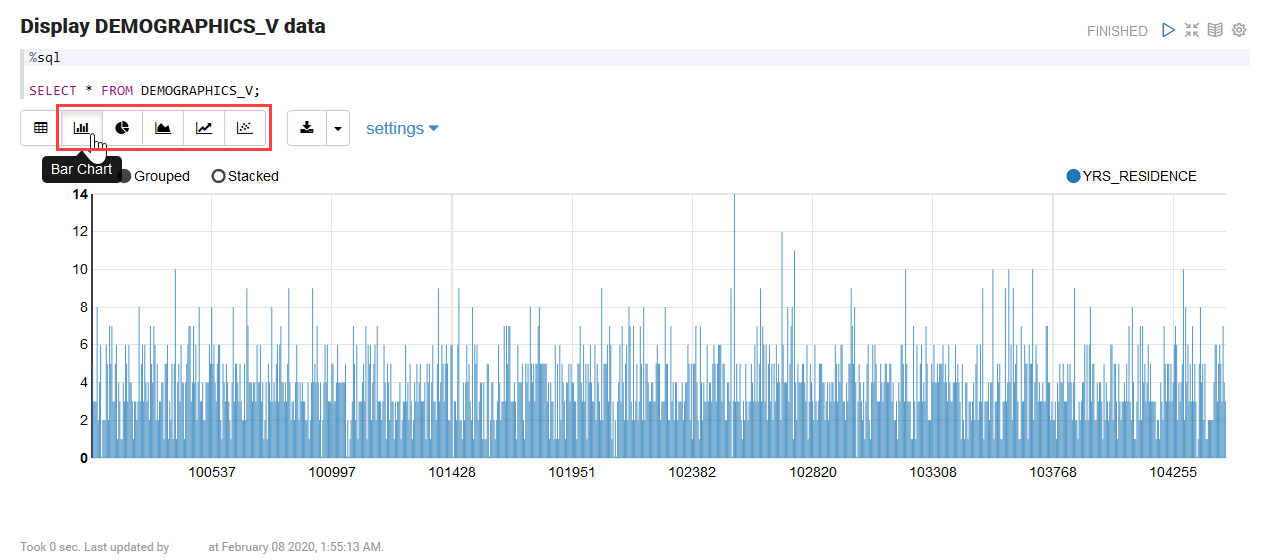
%sql: Supports standard SQL statements. In%sqlthe results of aSELECTstatement are directly displayed in a table viewer, with access to other visualization options. Use the options in the chart settings to perform groupings, summation, and other operations.%script: Supports both SQL statements and PL/SQL. In%script, the results of aSELECTstatement are provided as text string output.%conda: Supports the Conda environment. Type%condaat the beginning of the paragraph to connect to the Conda environment and work with third-party libraries for Python.%r: Supports R scripts. Type%rat the beginning of the paragraph to connect to the R interpreter.%python: Supports Python scripts. Type%pythonat the beginning of the paragraph to connect to the Python interpreter.%md: Supports Markdown markup language.
Note:
To run a Group By on all your data, then it is recommended to use SQL scripts to do the grouping in the database, and return the summary information for charting in the notebook. Grouping at the notebook level works well for small sets of data. If you pull too much data to the notebook, you may encounter issues due to insufficient memory. You can set the row limit for your notebook by using the option Render Row Limit on the Connections Group page.- About Oracle Machine Learning for SQL
Oracle Machine Learning for SQL (OML4SQL) provides a powerful, state-of-the-art machine learning capability within Oracle AI Database. You can use Oracle Machine Learning for SQL to build and deploy predictive and descriptive machine learning models, add intelligent capabilities to existing and new applications. - Set Output Format in Notebooks
Oracle Machine Learning Notebooks allow you to preformat query output in notebooks. - Output Formats Supported by SET SQLFORMAT Command
By using theSET SQLFORMATcommand, you can generate the query output in a variety for formats.
Related Topics
Parent topic: OML Notebooks
4.7.1 About Oracle Machine Learning for SQL
Oracle Machine Learning for SQL (OML4SQL) provides a powerful, state-of-the-art machine learning capability within Oracle AI Database. You can use Oracle Machine Learning for SQL to build and deploy predictive and descriptive machine learning models, add intelligent capabilities to existing and new applications.
Oracle Machine Learning for SQL offers an extensive set of in-database algorithms for performing a variety of machine learning tasks, such as classification, regression, anomaly detection, feature extraction, clustering, and market basket analysis, among others. The programmatic interfaces to OML4SQL are PL/SQL for building and maintaining models and a family of SQL functions for scoring.
%sql)
and PL/SQL scripts (%script) respectively. Use Oracle Machine Learning for SQL to:
- Perform data exploration and data analysis
- Build, evaluate and deploy machine learning models, and
- Score data using those models
Parent topic: Use the SQL Interpreter in a Notebook Paragraph
4.7.2 Set Output Format in Notebooks
Oracle Machine Learning Notebooks allow you to preformat query output in notebooks.
SET SQLFORMAT as follows:
Parent topic: Use the SQL Interpreter in a Notebook Paragraph
4.7.3 Output Formats Supported by SET SQLFORMAT Command
By using the SET SQLFORMAT command, you can generate the query output in a variety for formats.
Note:
These output formats are available for the Script interpreter. Therefore, you must include the prefix%script.
-
CSV: The CSV format produces standard comma-separated variable output, with string values enclosed in double quotes. The syntax is:
%scriptSET SQLFORMAT CSV -
HTML: The HTML format produces the HTML for a responsive table. The content of the table changes dynamically to match the search string entered in the text field. The syntax is:
%scriptSET SQLFORMAT HTML -
XML: The XML format produces a tag based XML document. All data is presented as
CDATAtags. The syntax is:%scriptSET SQLFORMAT XML -
JSON: The JSON format produces a JSON document containing the definitions of the columns along with the data that it contains. The syntax is:
%scriptSET SQLFORMAT JSON -
ANSICONSOLE: The ANSICONSOLE format resizes the columns to the width of the data to save space. It also underlines the columns, instead of separate line of output. The syntax is:
%scriptSET SQLFORMAT ANSICONSOLE -
INSERT: The INSERT format produces the INSERT statements that could be used to recreate the rows in a table. The syntax is:
%scriptSET SQLFORMAT INSERT -
LOADER: The LOADER format produces pipe delimited output with string values enclosed in double quotes. The column names are not included in the output. The syntax is:
%scriptSET SQLFORMAT LOADER -
FIXED: The FIXED format produces fixed width columns with all data enclosed in double-quotes. The syntax is:
%scriptSET SQLFORMAT FIXED -
DEFAULT: The DEFAULT option clears all previous
SQLFORMATsettings, and returns to the default output. The syntax is:%scriptSET SQLFORMAT DEFAULTNote:
You can also run this command without the format nameDEFAULTby simply typingSET SQLFORMAT. -
DELIMITED: The DELIMITED format allows you to manually define the delimiter string, and the characters that are enclosed in the string values. The syntax is:
%scriptSQLFORMAT DELIMITED delimiter left_enclosure right_enclosureFor example,
%scriptSET SQLFORMAT DELIMITED ~del~ " "SELECT * FROM emp WHERE deptno = 20;Output:
"EMPNO"~del~"ENAME"~del~"JOB"~del~"MGR"~del~"HIREDATE"~del~"SAL"~del~"COMM"~del~"DEPTNO"In this example, the delimiter string is
~del~and string values such asEMPNO, ENAME, JOBand so on, are enclosed in double quotes.
Parent topic: Use the SQL Interpreter in a Notebook Paragraph
 . Alternatively, press Shift+Enter keys to run the notebook.
