Strategic Field Demand Planning using Fusion Claw
Field Service is already strong at optimizing today’s work - deciding which resource must perform which activity, when, and where. However, when it comes to planning months ahead, the process remains largely manual and reactive. Demand, capacity, calendars, work zones, travel, skills, backlog, and inventory are distributed across separate views and sometimes even separate sources of data. This leaves operational leaders to interpret risk and determine corrective actions on their own – which is laborious and time-consuming.
Empowered by Oracle Fusion Claw, Strategic Field Demand Planning closes that gap. It provides an insights-first experience and helps identify future demand-and-capacity risks early and compare practical workforce responses before service performance is affected. It presents key performance indicators (KPIs), ranks priority conditions, compares the baseline with up to three workforce scenarios, and recommends an optimal plan with its expected impact and tradeoffs.
Note: This capability only applies to Oracle Fusion Field Service on Fusion environments. You can verify whether you've Oracle Field Service or Oracle Fusion Field Service, by signing in and checking on the About page.
Feature Description
The feature combines historical Work Order demand with Field Service resource, skill, location, and schedule context to provide an execution-aware planning view. It helps users detect future capacity shortages or surpluses early enough to consider workforce changes before service levels, backlog, overtime, or utilization are adversely affected.
Demand and Workload Forecast
- Past or actual demand uses the service Work Order Created Date wherever it is available.
- Forecasting is performed at the Date x Bucket x Activity Type level.
- For each combination, the feature forecasts the number of activities and converts it to forecast workload using the estimated activity duration and estimated travel duration.
- Forecast workload can also be viewed at rolled-up bucket levels.
- Zero-demand days remain in the forecast input and are not omitted.
Forecast workload: Forecast number of activities x (estimated activity duration + estimated travel duration based on destination).
Capacity and KPI Analysis
The outcome compares forecast demand with resource capacity that is qualified for the relevant work by skill and location. It evaluates visible service areas and work types using these KPIs:
- SLA compliance: The projected percentage of work completed within the applicable service commitment.
- Time to Service: The projected time between demand and service delivery.
- Idle Time: The projected productive capacity that is not used, typically shown as hours per week.
- Overtime: The projected work that must be performed beyond planned capacity or schedule.
Fusion Claw Analysis Flow
A typical Fusion Claw flow would be as follows:
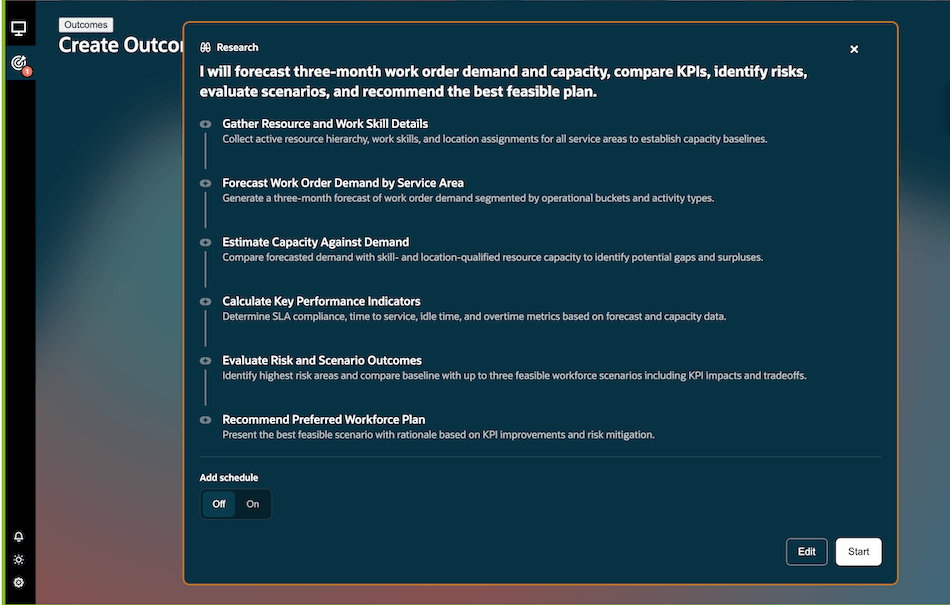
- Gather active resource hierarchy, work skills, and location assignments to establish capacity baselines.
- Forecast three-month Work Order demand by service area, operational bucket, and activity type.
- Compare demand with skill- and location-qualified resource capacity to identify gaps and surpluses.
- Calculate SLA compliance, Time to Service, Idle Time, and Overtime.
- Rank priority conditions and select the highest-risk bucket/KPI combination for deeper analysis.
- Evaluate the baseline against up to three feasible workforce scenarios, including projected outcomes and tradeoffs.
- Recommend the preferred feasible plan and explain why it is favoured.
Using the Preconfigured Outcome
The preconfigured prompt is:
Generate a three-month demand and capacity forecast for all service areas. Compare forecast Work Order demand with skill- and location-qualifying capacity; show KPIs: SLA compliance, Time to Service, Idle Time, and Overtime; identify the highest risk and compare the baseline with up to three feasible scenarios, showing scenario overview, projected KPI impact outcome, and tradeoffs. Recommend the preferred feasible plan and explain why.
This screenshot shows the Create Outcome page with a prompt:
Fusion Claw Output
A completed run provides a decision-oriented outcome rather than only a raw forecast. Depending on the available data, the output can include:
- A concise statement of the highest-risk service area and work type, together with the preferred workforce response.
- Current or baseline KPI values and projected values for the recommended plan.
- A ranked list of priority conditions across visible service areas and work types, including the affected period.
- A recommended workforce action with effective timing, estimated gap coverage, qualified coverage, residual gap, and operational rationale.
- An impact view comparing the primary KPI with and without the recommended plan.
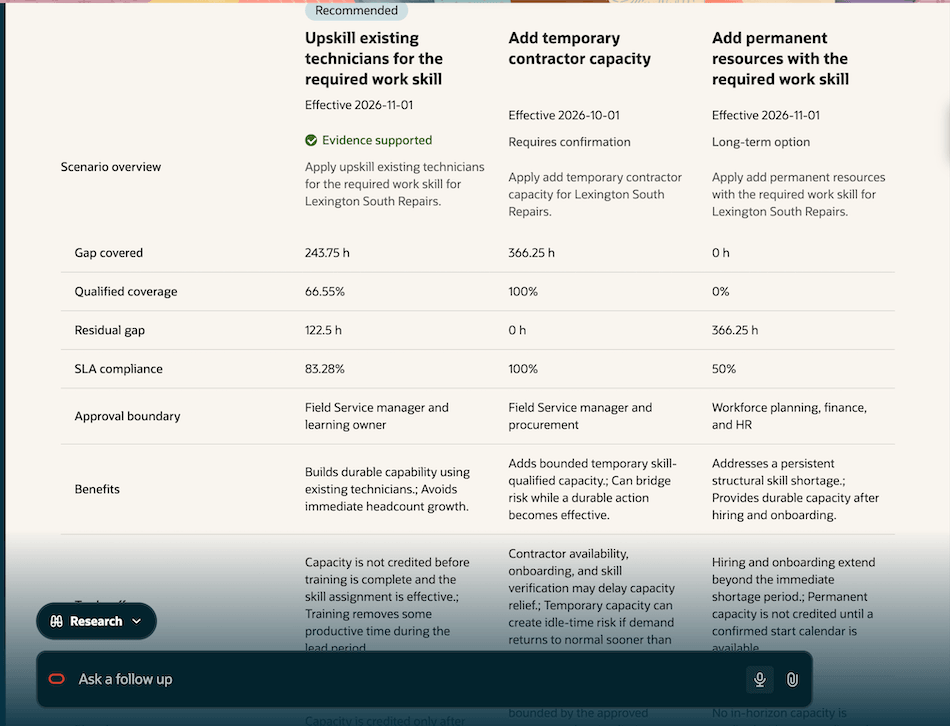
- Up to three independently evaluated scenarios, with one option identified as preferred when the evidence and policy constraints support it.
- Scenario details such as benefits, tradeoffs, planning notes, evidence status, and approvals that may be required before implementation.
This screenshot shows the three-month demand and capacity forecast (part of the page) based on the created outcome:
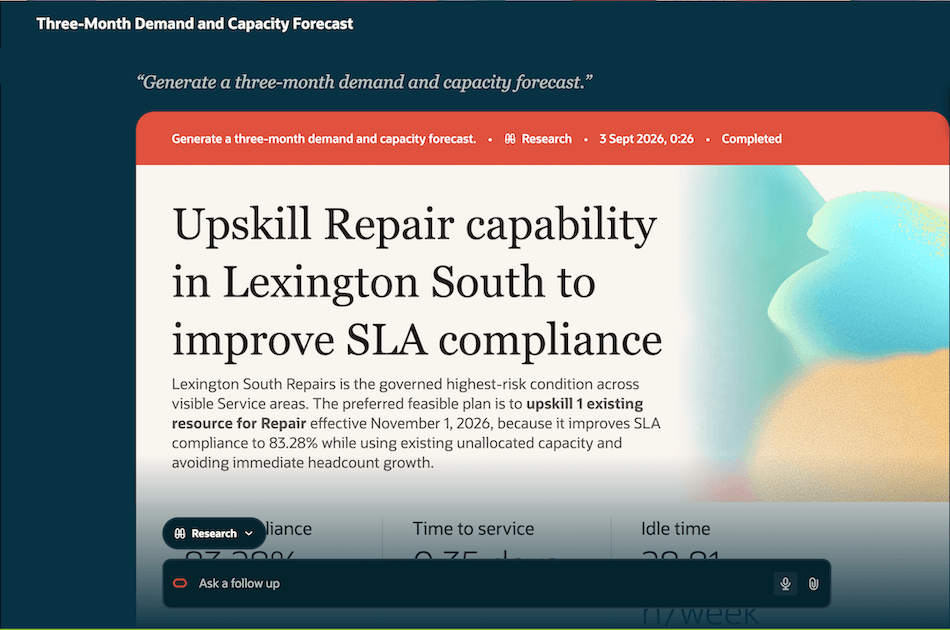
This screenshot shows the three-month demand and capacity forecast (part of the page) based on the created outcome:
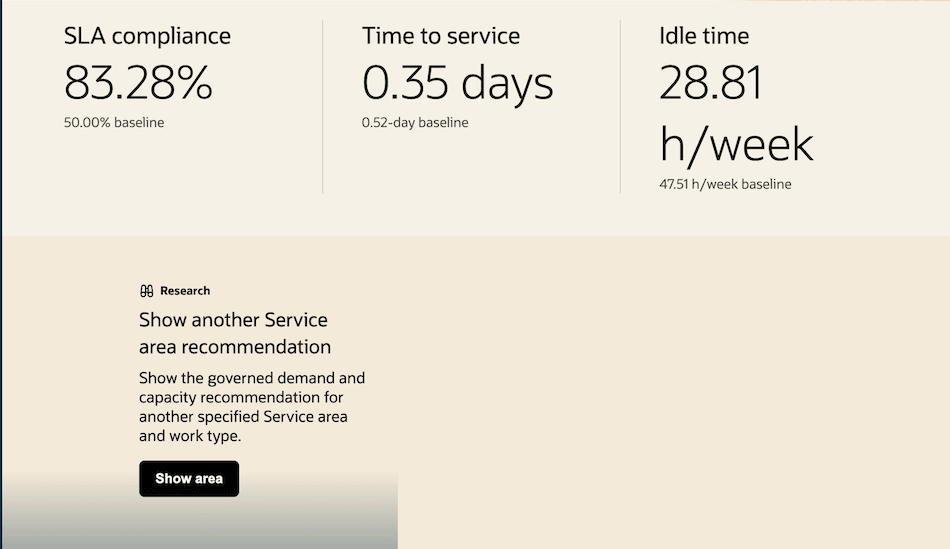
This screenshot shows the projected impact and the status of the service area:
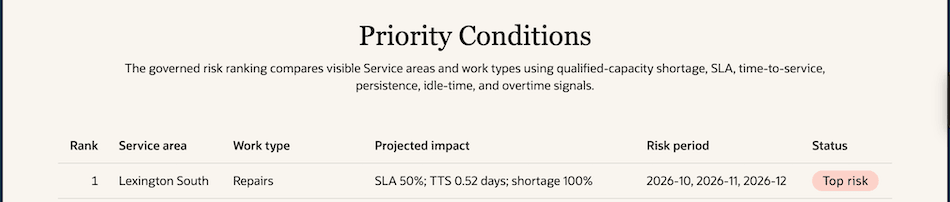
This screenshot shows a comparison of the evaluated risk and scenario outcomes:
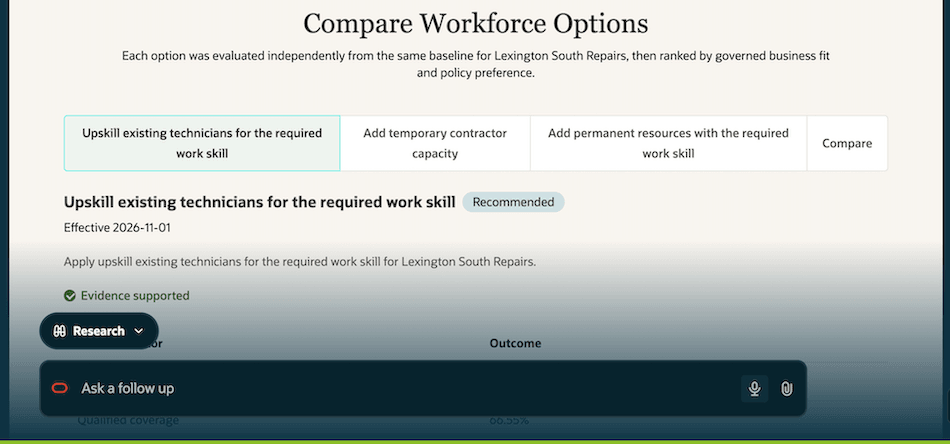
This screenshot shows the recommended workforce plan:
Types of Recommendations
The recommended scenarios can use a subset of the following workforce actions, subject to feasibility and the available evidence:
- Temporarily assign qualified resources from an adjacent area (60-minute drive time maximum, adjustable).
- Suggest overtime.
- Upskill existing resources for a required work skill.
- Add contractors to cover a temporary demand spike.
- Hire an in-house resource with the required skill to address a structural increase in demand..
Follow-Up Analysis
After the initial run, users can continue from the current analysis. Suggested actions can include:
- Show another service area recommendation.
- Ask a follow-up question in natural language to explore the effect of moving a specified number of qualified resources from a source service area to the highest-risk area.
Business Benefit
Strategic Field Demand Planning turns forward-looking demand into practical workforce decisions. Managers can identify service risk before demand materializes, understand whether the constraint is skills, location-qualified capacity, schedule, or sustained demand, and compare corrective actions using a consistent KPI view.
- Protect service commitments by identifying projected SLA and Time to Service risk earlier.
- Reduce reactive overtime and backlog by planning capacity changes before the shortage period.
- Improve utilization by identifying both capacity shortages and excessive Idle Time across Service areas.
- Use existing workforce capacity more effectively through temporary reassignment or targeted upskilling.
- Avoid unnecessary hiring or contractor cost by comparing temporary, developmental, and permanent responses before choosing a plan.
- Make planning decisions more transparent by showing the baseline, projected KPI impact, residual risk, tradeoffs, and approval boundary for each scenario.
Steps to enable and configure
Provide the required access before using the feature. Details are in the Access Requirements section.
- Ensure that your user has a role that has these permissions:
Duty Roles:
ORA_SVC_SR_CONTRIBUTOR
ORA_SVC_SR_TROUBLESHOOTER
ORA_RCL_FIELD_SERVICE_TECHNICIAN_DUTY
Permission Groups:
oraCxFieldService_read_Resource_OraResource
oraCxFieldService_read_ResourceWorkSkill_OraResource
oraCxFieldService_read_ResourceLocationAssignment_OraResource
oraCxFieldService_read_ResourceLocation_OraResource
oraCxFieldService_read_ResourceWorkScheduleCalendar_OraResource
oraCxFieldService_read_ResourceType_OraResource
oraCxFieldService_read_BookingDependency_OraResource
oraCxFieldService_read_WorkSkillCondition_OraResource
- Navigate to Oracle AI Agent Studio for Fusion Applications and then open Fusion Claw. For more information about the access requirements for Oracle AI Agent Studio for Fusion Applications, see Access Requirements for AI Agent Studio.
- Find and open Strategic Field Demand Planning Fusion Claw.
- Open Outcomes: Navigate to the Fusion Claw Outcomes experience and select Create Outcome.
- Select Research: In the outcome type selector, choose Research.
- Choose the preconfigured example: Select Generate a three-month Work Order demand and capacity plan. The full preconfigured prompt is displayed in the request field.
- Submit the request: Submit the preconfigured prompt. You can retain the supplied wording to use the governed three-month planning flow.
- Review the plan: Review the generated steps for resource and work-skill collection, demand forecasting, capacity comparison, KPI calculation, scenario evaluation, and recommendation. Select Edit only if your workflow permits a change; otherwise select Start.
- Wait for completion: Fusion Claw gathers the available data and prepares the forecast and scenario analysis. Processing time depends on the visible data and environment.
- Review the outcome: Start with the highest-risk condition and headline KPI impact, then inspect the priority ranking, recommended action, impact trajectory, and scenario comparison.
- Continue the analysis: Use a suggested follow-up action or ask a follow-up question. Review any stated tradeoff, evidence status, effective date, or approval boundary before taking an operational action.
Permissions and required roles may change in future releases, and existing configurations may need to be updated.
Tips and considerations
- MVP maturity: This initial release provides a foundation for early-stage demand and capacity planning, with ongoing enhancement planned as the capability matures and incorporates broader operational scenarios.
- Historical data requirement: Forecast calculation requires at least six months of historical data. A longer, representative history generally provides a more seasonal context.
- Forecast horizon: The preconfigured outcome requests three months. The broader calculation supports a future period based on the available history, up to 180 days.
- Data completeness: Maintain accurate Work Order Created Dates, estimated activity durations, travel-duration inputs, work skills, resource locations, schedules, and service area assignments. Missing or stale qualification data can affect both demand workload and capacity estimates.
- Visible scope: Fusion Claw analyzes service areas and buckets visible to the current user. Results should not be interpreted as an enterprise-wide view when the user has limited visibility.
- Zero-demand days: Zero-demand days are retained by the forecasting algorithm and should not be removed from source history solely to simplify the data.
- Prioritization: The result highlights the most impacted bucket/KPI combination and may surface up to five priority buckets. Review lower-ranked risks as well when several areas have similar exposure.
- Scenario limits: The outcome compares the baseline with up to three feasible scenarios. A scenario may not eliminate the full gap, and the preferred plan can retain residual risk.
- Independent comparison: Options are evaluated from the same baseline. Do not add the projected benefits of separate scenarios together unless a new combined scenario is explicitly modeled.
- Recommendations are advisory: Validate local policies, labor rules, skill verification, travel feasibility, schedules, costs, and approvals before implementation.
- Effective dates matter: Capacity should be credited only when the reassignment, schedule change, training, contractor onboarding, or hiring action is operationally effective.
- Use follow-ups for sensitivity analysis: Model a resource move or demand change to understand how robust the preferred recommendation is before committing to it.
- Interpret generated metrics as planning projections: Forecasts and scenario outcomes support decisions; they are not guarantees of future service performance.
Access requirements
Ensure that your user has a role that has these permissions:
- Duty Roles:
- ORA_SVC_SR_CONTRIBUTOR
- ORA_SVC_SR_TROUBLESHOOTER
- ORA_RCL_FIELD_SERVICE_TECHNICIAN_DUTY
- Permission Groups:
- oraCxFieldService_read_Resource_OraResource
- oraCxFieldService_read_ResourceWorkSkill_OraResource
- oraCxFieldService_read_ResourceLocationAssignment_OraResource
- oraCxFieldService_read_ResourceLocation_OraResource
- oraCxFieldService_read_ResourceWorkScheduleCalendar_OraResource
- oraCxFieldService_read_ResourceType_OraResource
- oraCxFieldService_read_BookingDependency_OraResource
- oraCxFieldService_read_WorkSkillCondition_OraResource
Ensure that the access requirements for Oracle AI Agent Studio for Fusion Applications, as given in the Access Requirements for AI Agent Studio topic are satisfied.