Project Dashboard
Similar to your main NetSuite Home dashboard, you can access a project dashboard with information specific to an individual project.
The project dashboard offers portlets and quick links for creating project tasks, managing resources, viewing the Gantt chart, and entering time and expenses.
There are visual indicators to quickly give you an idea of the project's status. The % Complete Meter shows where your project is on the timeline, and Key Performance Indicators give you more details about project health.
You can also view a list of project tasks and resource allocations directly from the Project Dashboard. You can customize the dashboard with additional standard and custom portlets and rearrange them by clicking Personalize Dashboard at the top of the page.
To view the project dashboard for a project, click the Dashboard icon at the top of the project record or in the Projects list.
Personalizing a Project Dashboard
NetSuite gives you a default set of project dashboard portlets, but you can personalize the dashboard in almost any way you want.
You can personalize a dashboard in the following ways:
Add content to a dashboard
-
Click the Personalize Dashboard link in the top right corner of the page.
-
On the Add Content panel that appears on the left side of the page, click on content to add it to a default location on the page, or drag and drop it to another location.
-
Content that is already displayed includes a check mark and bold text.
-
You can hover your cursor over a folder or content listing to see popup help.
-
Delete content from a dashboard
-
Select Remove from the menu in the upper right corner to remove the portlet.
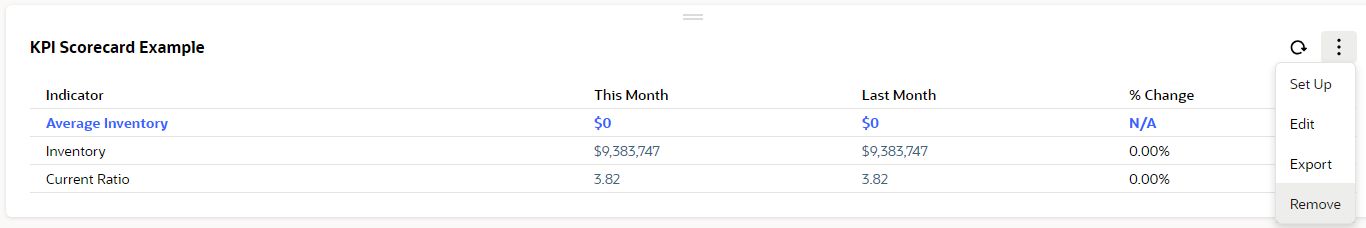
(You can't remove a portlet from the dashboard using the Add Content panel; there's no mechanism within the panel for clearing a content listing.)
Set up portlet content
-
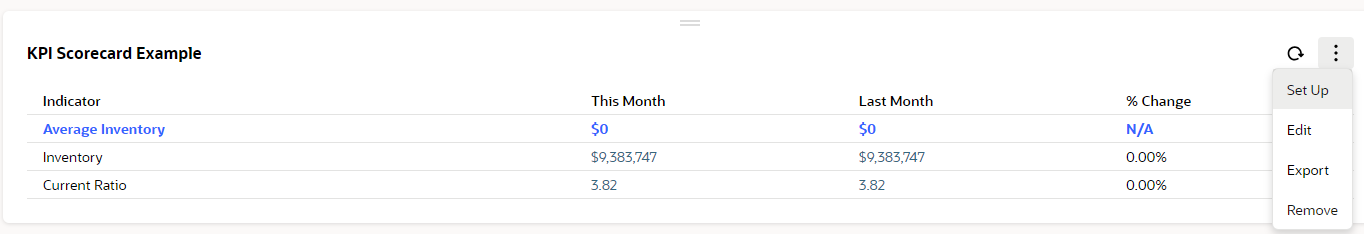
After the portlets appear on the project dashboard, most have a Set Up link available under a dropdown arrow in the upper right corner. Click this link to open a popup window where you can choose data to display in the portlet and define portlet layout options.
For complex financial reports (like Income Statement Report), the KPI portlet might show data from all projects. To see data for only one chosen project, create a custom report with project filters. For more information, see Custom KPIs and Report Customization
Print or export portlet content
-
The KPI Meter portlet lets you print or export content from the same menu as the Set Up option. You can print the chart or download it as PNG, JPG, PDF, or SVG.
-
Each popup trend graph includes a button for printing the chart, a button for downloading it to a PNG, JPG, PDF, or SVG file, and an Export to CSV link.
Minimize portlets on a dashboard
-
To minimize a portlet, click on the title bar at the top of the portlet. Minimizing a portlet prevents it from loading when the page is generated, which helps it load faster. After the page is loaded, you can click the title bar again to display its contents as needed.
If a dashboard contains a portlet that's extremely slow to load, the first time the portlet opens, NetSuite may display a popup suggesting that you minimize the portlet to speed up the dashboard loading time.
Refresh portlet content
-
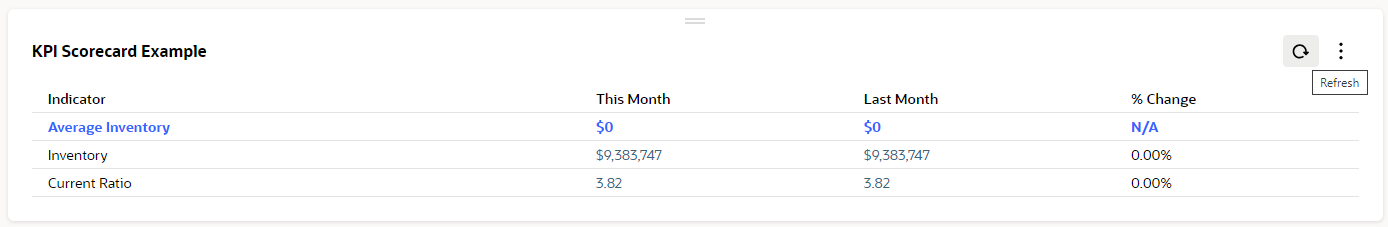
Portlets with content that's calculated from current data include a Refresh icon in the upper right corner. Click the icon to get the latest data.
Rearrange portlets on a dashboard
-
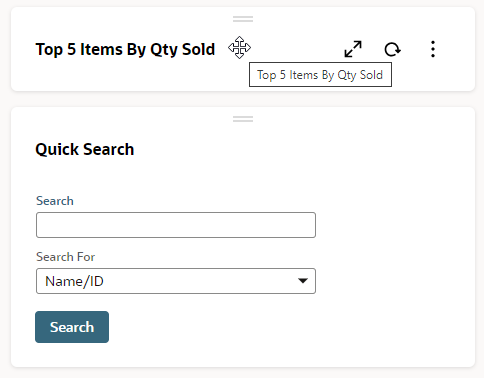
You can drag and drop portlets to rearrange them. Click the header and move the portlet wherever you want-above, below, or in any column. For more detailed steps to drag and drop portlets, see Arranging Dashboard Portlets.
Depending on the type, some portlets will display more detailed information if placed in the center column of a page.