Viewing the Concurrency Count Chart in the Concurrency Details Dashboard
Use the Concurrency Count Chart in the Concurrency Details dashboard to see the exact concurrency counts for each minute of the hour you picked.
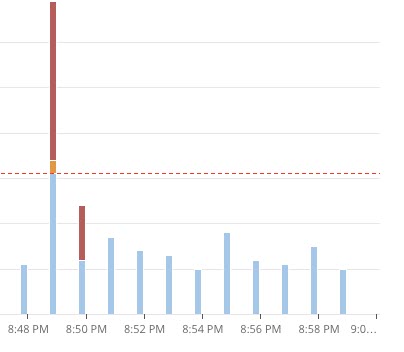
The Concurrency Count chart shows which minutes are within or over the limit, and which have errors. The dotted red line marks your concurrency limit for that hour. Red bars mean concurrency requests hit errors.
If there are a lot of errors, the error bars go above the dotted red line. Sometimes errors show up in more than the first minute. Errors can appear in following minutes too, even if the concurrency count is below the limit.
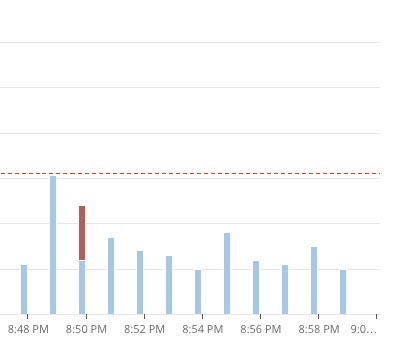
For example, in the next chart, there's a high error count above the line at 8:49 p.m. Errors still appear at 8:50 p.m., even though the concurrency count drops below the line.
Errors shouldn't show up below the dotted red line unless they happen right after a minute with a lot of errors. If your chart shows errors below the line for no clear reason, reach out to NetSuite Customer Support.
To see how many requests ran within or over the limit, also known as hit errors, point to a bar on the chart. To see more minutes, click and drag to zoom in on the chart.
When you hover over a bar, you'll see a View Requests link in the tooltip. Click it to open the Concurrency Request Logs window. For more information, see Viewing Request Logs in the Concurrency Details Dashboard.